

A Long-Lived Fe(III)-(Hydroperoxo) Intermediate in the Active H200C Variant of Homoprotocatechuate 2,3-Dioxygenase: Characterization by Mössbauer, Electron Paramagnetic Resonance, and Density Functional Theory Methods
- PMID: 26485328
- PMCID: PMC4630108
- DOI: 10.1021/acs.inorgchem.5b01576
A Long-Lived Fe(III)-(Hydroperoxo) Intermediate in the Active H200C Variant of Homoprotocatechuate 2,3-Dioxygenase: Characterization by Mössbauer, Electron Paramagnetic Resonance, and Density Functional Theory Methods
Abstract
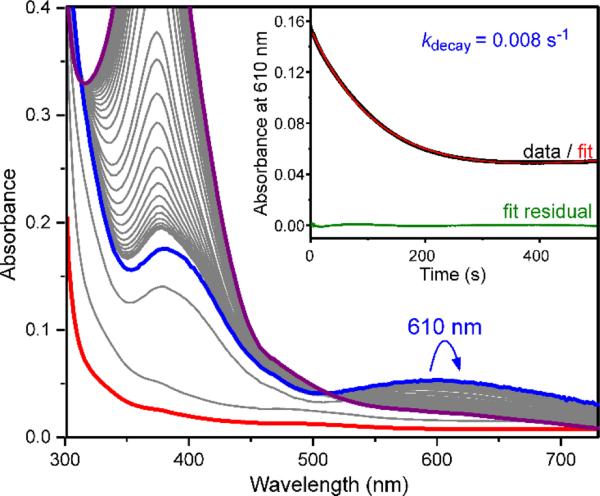
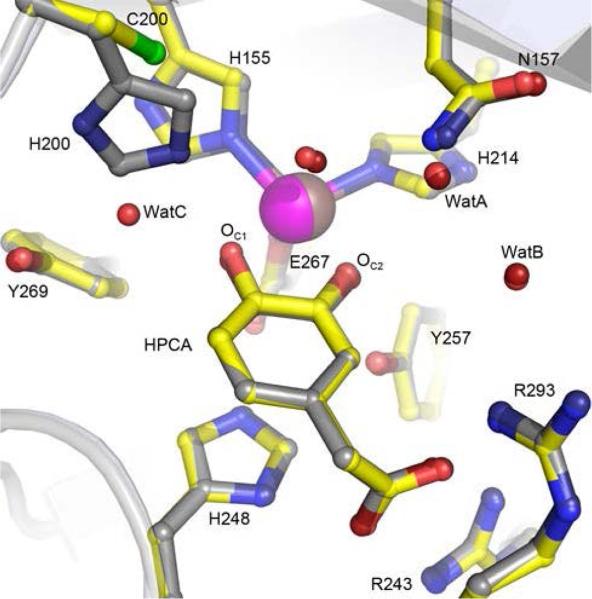
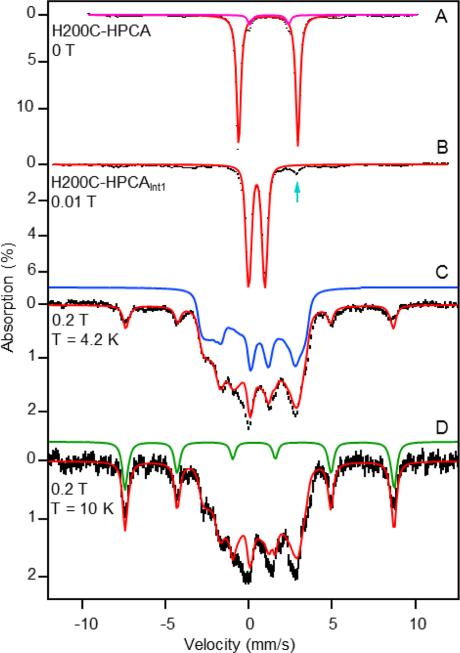
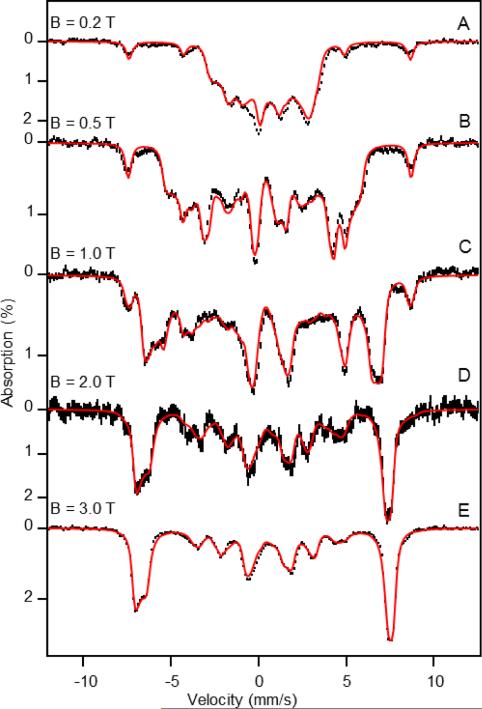
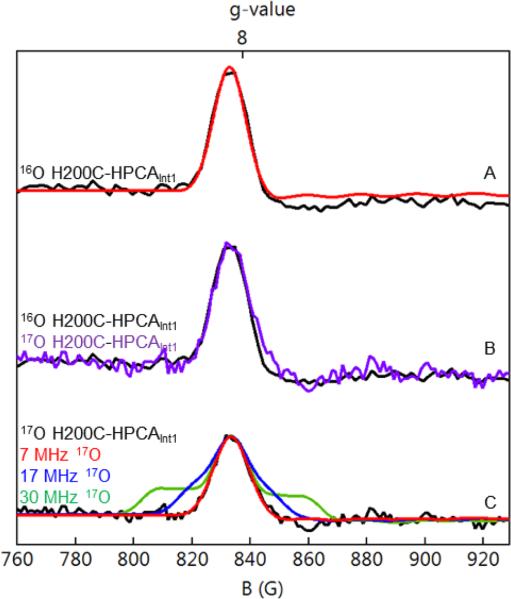
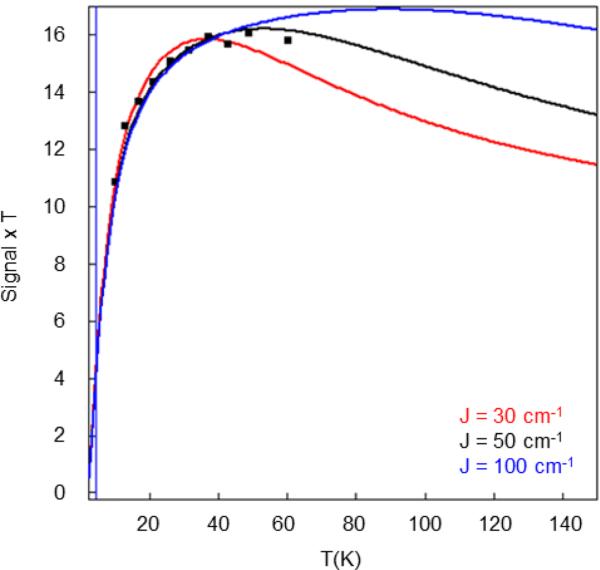
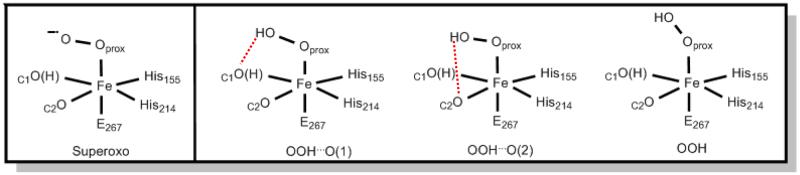
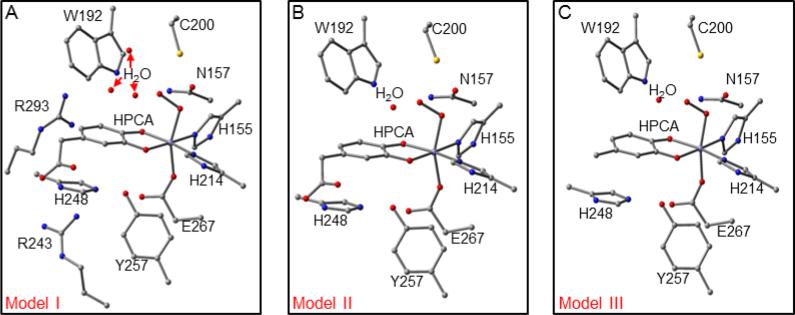
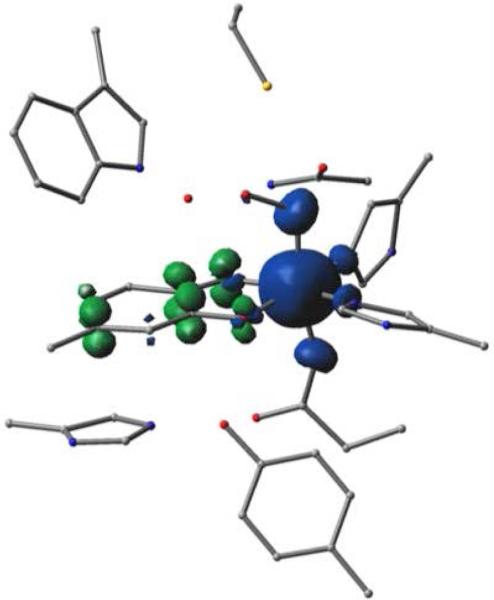
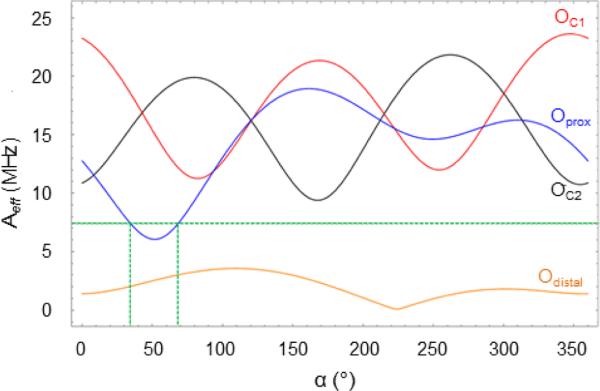
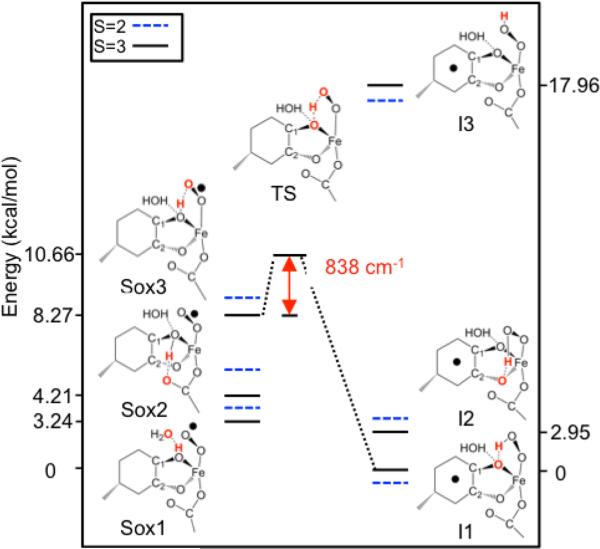
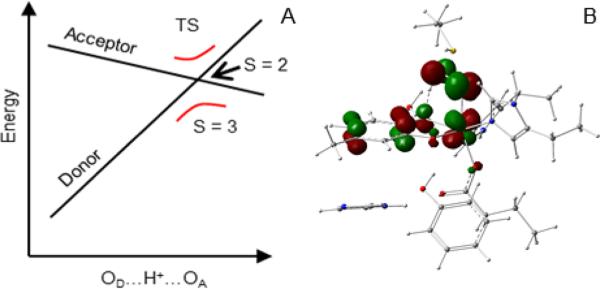
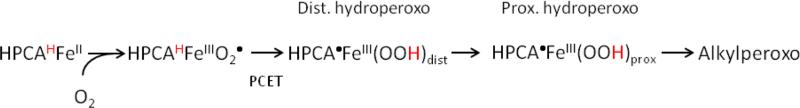
The extradiol-cleaving dioxygenase homoprotocatechuate 2,3-dioxygenase (HPCD) binds substrate homoprotocatechuate (HPCA) and O2 sequentially in adjacent ligand sites of the active site Fe(II). Kinetic and spectroscopic studies of HPCD have elucidated catalytic roles of several active site residues, including the crucial acid-base chemistry of His200. In the present study, reaction of the His200Cys (H200C) variant with native substrate HPCA resulted in a decrease in both kcat and the rate constants for the activation steps following O2 binding by >400 fold. The reaction proceeds to form the correct extradiol product. This slow reaction allowed a long-lived (t1/2 = 1.5 min) intermediate, H200C-HPCAInt1 (Int1), to be trapped. Mössbauer and parallel mode electron paramagnetic resonance (EPR) studies show that Int1 contains an S1 = 5/2 Fe(III) center coupled to an SR = 1/2 radical to give a ground state with total spin S = 2 (J > 40 cm(-1)) in Hexch = JŜ1·ŜR. Density functional theory (DFT) property calculations for structural models suggest that Int1 is a (HPCA semiquinone(•))Fe(III)(OOH) complex, in which OOH is protonated at the distal O and the substrate hydroxyls are deprotonated. By combining Mössbauer and EPR data of Int1 with DFT calculations, the orientations of the principal axes of the (57)Fe electric field gradient and the zero-field splitting tensors (D = 1.6 cm(-1), E/D = 0.05) were determined. This information was used to predict hyperfine splittings from bound (17)OOH. DFT reactivity analysis suggests that Int1 can evolve from a ferromagnetically coupled Fe(III)-superoxo precursor by an inner-sphere proton-coupled-electron-transfer process. Our spectroscopic and DFT results suggest that a ferric hydroperoxo species is capable of extradiol catalysis.
Figures
Similar articles
-
Nuclear Resonance Vibrational Spectroscopy Definition of O2 Intermediates in an Extradiol Dioxygenase: Correlation to Crystallography and Reactivity.J Am Chem Soc. 2018 Dec 5;140(48):16495-16513. doi: 10.1021/jacs.8b06517. Epub 2018 Nov 26. J Am Chem Soc. 2018. PMID: 30418018 Free PMC article.
-
Enzyme Substrate Complex of the H200C Variant of Homoprotocatechuate 2,3-Dioxygenase: Mössbauer and Computational Studies.Inorg Chem. 2016 Jun 20;55(12):5862-70. doi: 10.1021/acs.inorgchem.6b00148. Epub 2016 Jun 8. Inorg Chem. 2016. PMID: 27275865 Free PMC article.
-
Oxy intermediates of homoprotocatechuate 2,3-dioxygenase: facile electron transfer between substrates.Biochemistry. 2011 Nov 29;50(47):10262-74. doi: 10.1021/bi201436n. Epub 2011 Nov 1. Biochemistry. 2011. PMID: 22011290 Free PMC article.
-
Substrate-mediated oxygen activation by homoprotocatechuate 2,3-dioxygenase: intermediates formed by a tyrosine 257 variant.Biochemistry. 2012 Nov 6;51(44):8743-54. doi: 10.1021/bi301114x. Epub 2012 Oct 29. Biochemistry. 2012. PMID: 23066705 Free PMC article.
-
A two-electron-shell game: intermediates of the extradiol-cleaving catechol dioxygenases.J Biol Inorg Chem. 2014 Jun;19(4-5):491-504. doi: 10.1007/s00775-014-1122-9. Epub 2014 Mar 11. J Biol Inorg Chem. 2014. PMID: 24615282 Free PMC article. Review.
Cited by
-
Nuclear Resonance Vibrational Spectroscopy Definition of Peroxy Intermediates in Catechol Dioxygenases: Factors that Determine Extra- versus Intradiol Cleavage.J Am Chem Soc. 2023 Jul 19;145(28):15230-15250. doi: 10.1021/jacs.3c02242. Epub 2023 Jul 6. J Am Chem Soc. 2023. PMID: 37414058 Free PMC article.
-
Reaction kinetics and interplay of two different surface states on hematite photoanodes for water oxidation.Nat Commun. 2021 Jan 11;12(1):255. doi: 10.1038/s41467-020-20510-8. Nat Commun. 2021. PMID: 33431853 Free PMC article.
-
The crystalline state as a dynamic system: IR microspectroscopy under electrochemical control for a [NiFe] hydrogenase.Chem Sci. 2021 Jun 3;12(39):12959-12970. doi: 10.1039/d1sc01734a. eCollection 2021 Oct 13. Chem Sci. 2021. PMID: 34745526 Free PMC article.
-
Nuclear Resonance Vibrational Spectroscopic Definition of Peroxy Intermediates in Nonheme Iron Sites.J Am Chem Soc. 2016 Nov 2;138(43):14294-14302. doi: 10.1021/jacs.6b07227. Epub 2016 Oct 19. J Am Chem Soc. 2016. PMID: 27726349 Free PMC article.
-
Nuclear Resonance Vibrational Spectroscopy Definition of O2 Intermediates in an Extradiol Dioxygenase: Correlation to Crystallography and Reactivity.J Am Chem Soc. 2018 Dec 5;140(48):16495-16513. doi: 10.1021/jacs.8b06517. Epub 2018 Nov 26. J Am Chem Soc. 2018. PMID: 30418018 Free PMC article.
References
-
- Dagley S. In: The Bacteria. Sokatch JR, Ornston LN, editors. Vol. 10. Academic Press; Orlando, FL: 1986. pp. 527–555. Chapter 10.
-
- Gibson DT, Parales RE. Curr. Opin. Biotechnol. 2000;11:236–243. - PubMed
-
- Gibson DT. Microbial Degradation of Organic Compounds. Marcel Dekker; New York, NY: 1984.
-
- Díaz E, Jiménez JI, Nogales J. Curr. Opin. Biotechnol. 2013;24:431–442. - PubMed
-
- Kojima Y, Itada N, Hayaishi OJ. Biol. Chem. 1961;236:2223–2228. - PubMed
Publication types
MeSH terms
Substances
Associated data
- Actions
- Actions
Grants and funding
LinkOut - more resources
Full Text Sources
Other Literature Sources
Research Materials
