. 2015 Dec;185(12):3274-89.
doi: 10.1016/j.ajpath.2015.08.019. Epub 2015 Oct 17.

Mice with Hepatic Loss of the Desmosomal Protein γ-Catenin Are Prone to Cholestatic Injury and Chemical Carcinogenesis

Affiliations

Mice with Hepatic Loss of the Desmosomal Protein γ-Catenin Are Prone to Cholestatic Injury and Chemical Carcinogenesis

Lili Zhou et al. Am J Pathol. 2015 Dec.

Abstract

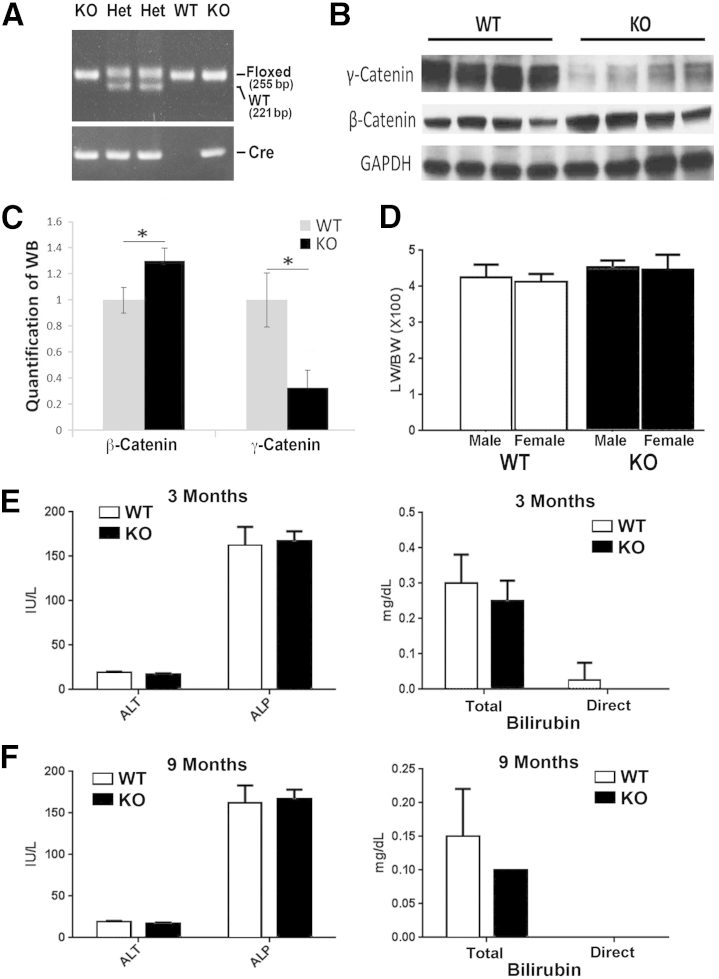
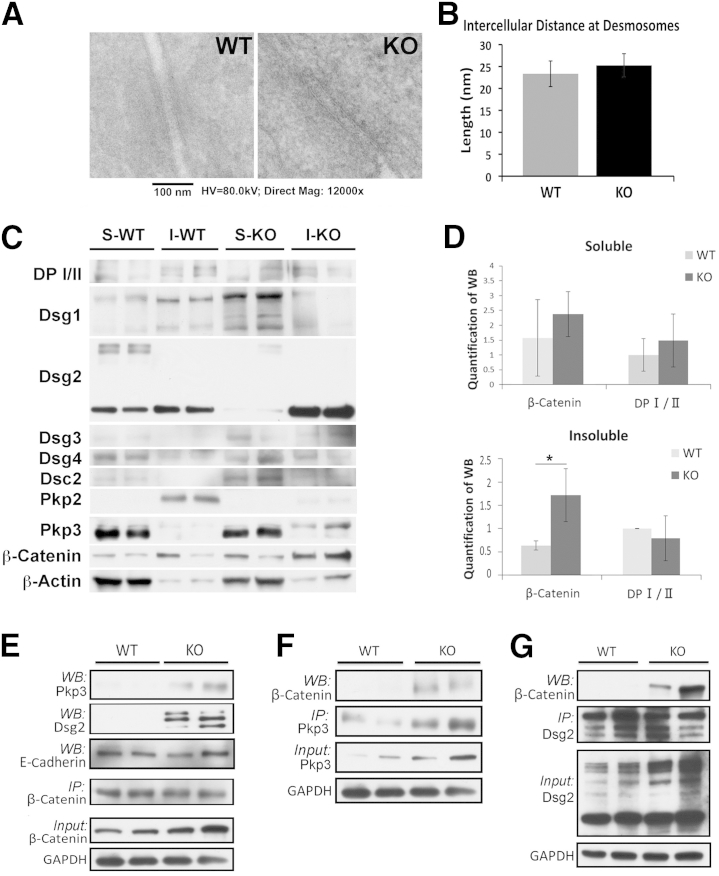
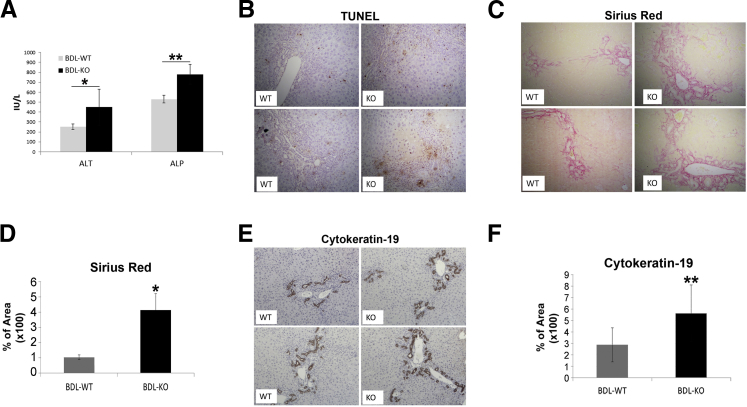
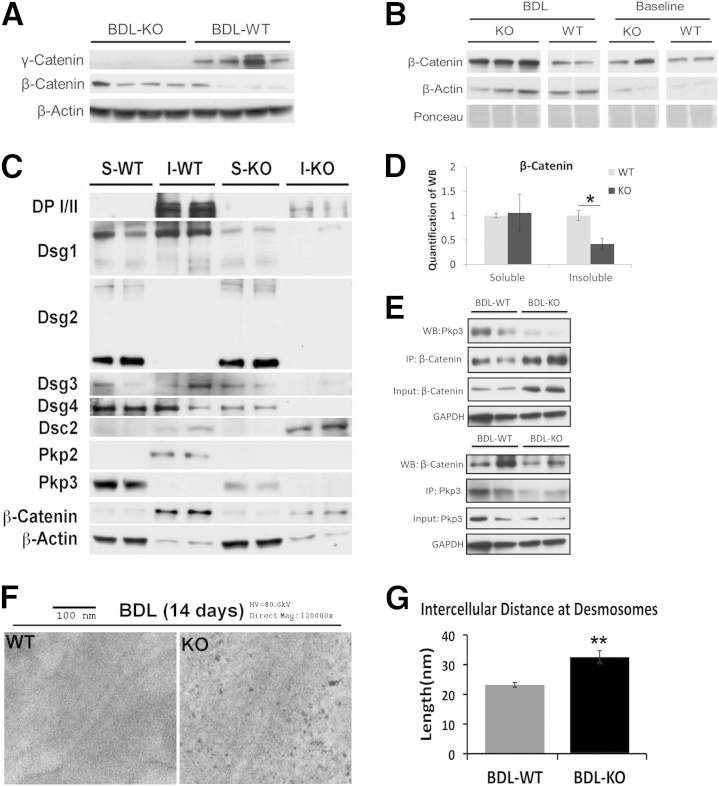
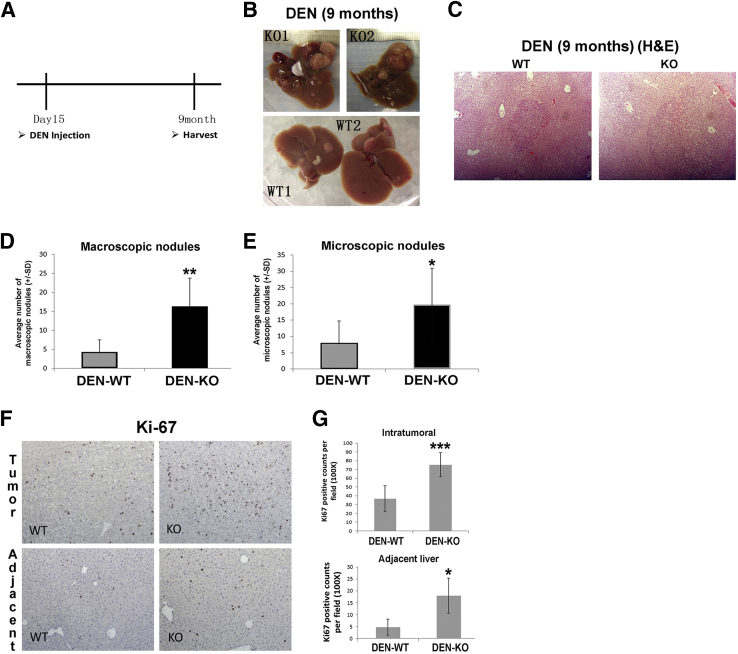
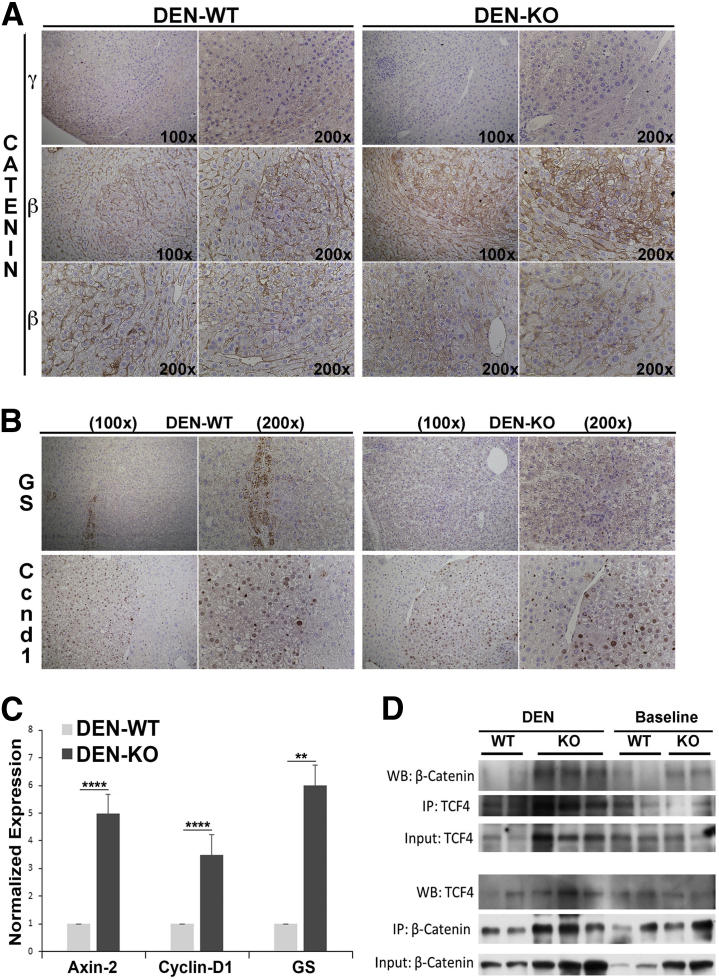
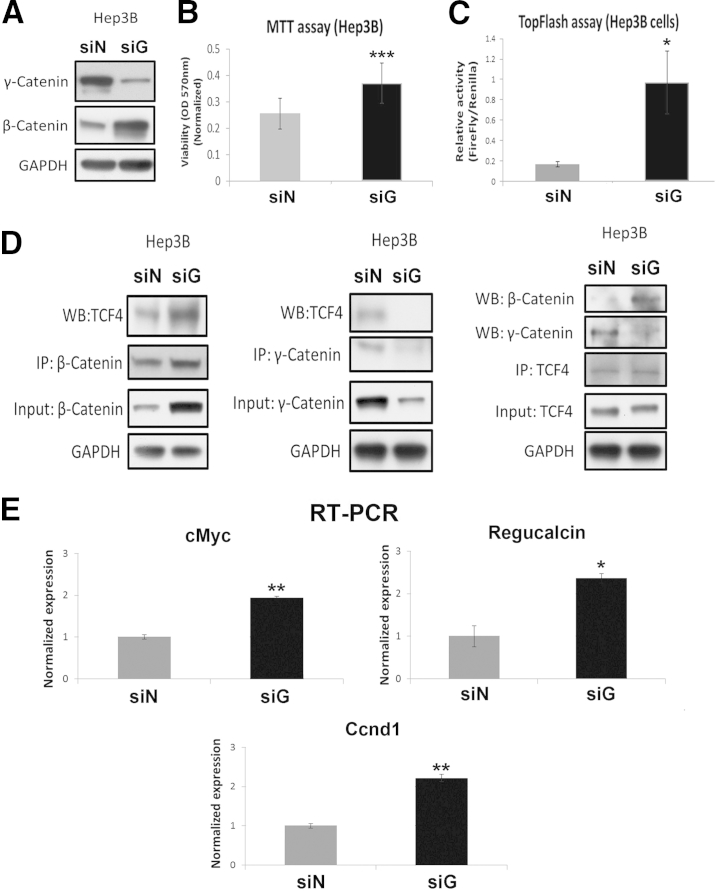
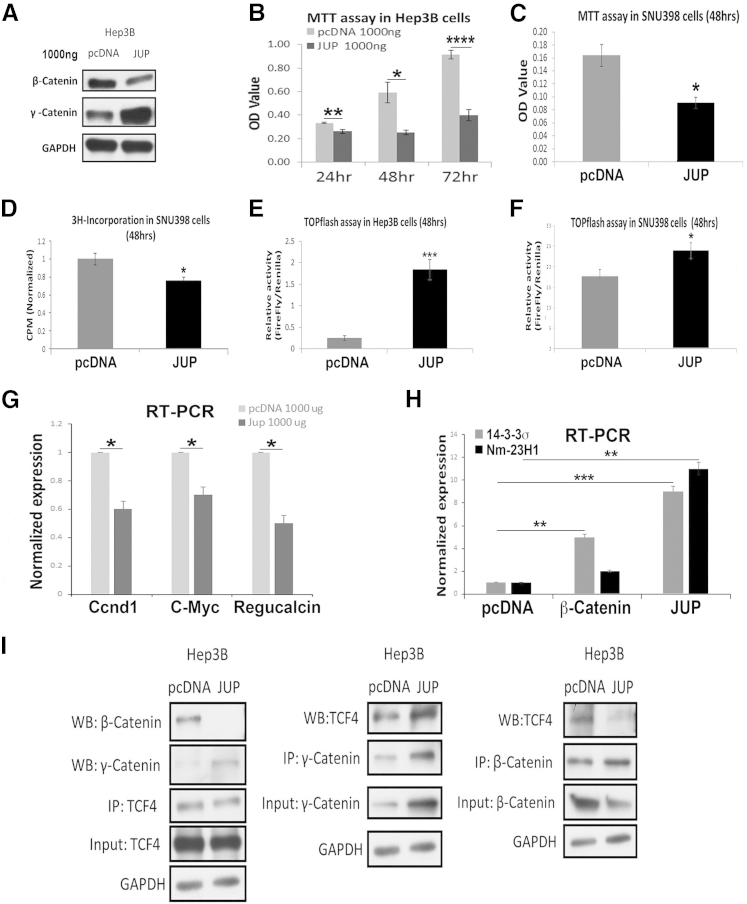
γ-Catenin, an important component of desmosomes, may also participate in Wnt signaling. Herein, we dissect the role of γ-catenin in liver by generating conditional γ-catenin knockout (KO) mice and assessing their phenotype after bile duct ligation (BDL) and diethylnitrosamine-induced chemical carcinogenesis. At baseline, KO and wild-type littermates showed comparable serum biochemistry, liver histology, and global gene expression. β-Catenin protein was modestly increased without any change in Wnt signaling. Desmosomes were maintained in KO, and despite no noticeable changes in gene expression, differential detergent fractionation revealed quantitative and qualitative changes in desmosomal cadherins, plaque proteins, and β-catenin. Enhanced association of β-catenin to desmoglein-2 and plakophilin-3 was observed in KO. When subjected to BDL, wild-type littermates showed specific changes in desmosomal protein expression. In KO, BDL deteriorated baseline compensatory changes, which manifested as enhanced injury and fibrosis. KO also showed enhanced tumorigenesis to diethylnitrosamine treatment because of Wnt activation, as also verified in vitro. γ-Catenin overexpression in hepatoma cells increased its binding to T-cell factor 4 at the expense of β-catenin-T-cell factor 4 association, induced unique target genes, affected Wnt targets, and reduced cell proliferation and viability. Thus, γ-catenin loss in liver is basally well tolerated. However, after insults like BDL, these compensations at desmosomes fail, and KO show enhanced injury. Also, γ-catenin negatively regulates tumor growth by affecting Wnt signaling.


Figures

Figure 1
Figure 1
Lack of an overt phenotype in liver-specific γ-catenin conditional knockout (KO). A: Representative genomic PCR for genotyping mice used in the study. Mice with floxed γ-catenin allele and cre allele were KO, whereas those with floxed and wild-type (WT) alleles and cre allele are heterozygous (Het) mice used for breeding. Mice with floxed γ-catenin only without cre were labeled as WT and used as controls for all studies. B: Representative Western blot (WB) shows a dramatic decrease of γ-catenin in the tissue lysates from the KO livers. There is a modest increase in β-catenin in the same lysates. C: Mean integrated OD of a representative WB shown in B for β-catenin and γ-catenin in WT and KO livers. D: Insignificant difference in liver weight/body weight (LW/BW) ratio in both male and female KO and WT mice. E: No significant differences in serum alanine transaminase (ALT), alkaline phosphatase (ALP), and total and direct bilirubin in 3-month-old KO and WT. F: No significant differences in serum ALT, ALP, and total and direct bilirubin in 9-month-old KO and WT. *P < 0.05. GAPDH, glyceraldehyde-3-phosphate dehydrogenase.
Figure 2
Figure 2
Maintenance of desmosomes in the absence of γ-catenin because of quantitative and qualitative changes in other junctional proteins. A: Transmission electron microscopy of γ-catenin knockout (KO) and wild-type (WT) livers shows the presence of normal desmosomes in both. B: Comparable intercellular distance between hepatocytes at desmosomes in KO and WT livers (mean distance: KO = 25.2 nm; WT = 23.3 nm; P > 0.3). C: Representative Western blot (WB) shows changes in various desmosomal proteins and β-catenin in the soluble (S) and insoluble (I) fractions in WT and KO. Desmoplakin (DP) I (250 kDa), DP II (210 kDa), desmoglein (Dsg) 1 (150 kDa), Dsg2 (59 to 150 kDa), Dsg3 (55 to 130 kDa), Dsg4 (100 to 150 kDa), desmocollin (Dsc) 2 (100 kDa), plakophilin (Pkp) 2 (100 kDa), Pkp3 (87 kDa), and β-catenin (92 kDa). D: Mean integrated OD of a representative WB shown in C for β-catenin and DP I/II in soluble and insoluble fractions. E: Representative immunoprecipitation (IP) studies using β-catenin pull down in whole cell lysates show notably increased association with Dsg2 and Pkp3 in KO compared with WT livers. F: Representative IP study shows Pkp3 pull down and its enhanced association with β-catenin in the KO versus WT liver lysates. G: Representative IP study shows Dsg2 pull down and its enhanced association with β-catenin in the KO versus WT liver lysates. *P < 0.05. GAPDH, glyceraldehyde-3-phosphate dehydrogenase; HV, high voltage; Mag, magnification.
Figure 3
Figure 3
Increased injury in γ-catenin knockout (KO) mice after bile duct ligation (BDL). A: Serum alanine transaminase (ALT) and alkaline phosphatase (ALP) show a significant increase in KO mice after BDL. [Mean ALT for KO = 448.8 IU/L, wild type (WT) = 251.3 IU/L; mean ALP for KO mice = 780.6 IU/L, WT = 530.2 IU/L.] B: Immunohistochemistry (IHC) for terminal deoxynucleotidyl transferase dUTP nick end labeling (TUNEL) shows more cell death in KO liver after BDL. C: Sirius red staining shows greater collagen deposition in KO livers after BDL. D: Quantification of Sirius red staining shows greater area stained in KO livers after BDL (WT = 1.0%, KO = 4.1%). E: IHC for CK19 shows a greater biliary ductular reaction in KO livers after BDL. F: Quantification of CK19 staining shows a significant increase in CK19-positive ducts in KO livers compared with WT after BDL (KO = 5.6%, WT = 2.9%). *P < 0.05, **P < 0.01.
Figure 4
Figure 4
Disparate changes in desmosomal proteins in knockout (KO) compared with wild type (WT) after bile duct ligation (BDL). A: Representative Western blot (WB) shows a notable increase in total levels of β-catenin in KO livers after BDL, whereas γ-catenin continues to be absent in the KO. B: Another representative WB shows a basal and BDL-induced increase in total β-catenin in KO compared with WT at baseline and after BDL. The samples were run in triplicate for KO BDL and in duplicate for all other groups. The samples in WT BDL have been spliced together. C: Representative WB shows changes in desmosome proteins and β-catenin in both soluble (S) and insoluble (I) fractions of WT and KO livers after BDL. D: Mean integrated OD of a representative WB shown in C for β-catenin in soluble and insoluble fractions. E: Representative immunoprecipitation (IP) shows a decrease in β-catenin– plakophilin (Pkp) 3 association in KO livers after BDL. Top panel: Pull down of β-catenin and WB for Pkp3. Bottom panel: IP of Pkp3 and WB for β-catenin using whole cell lysates. F: Representative transmission electron micrographs of KO and WT livers after BDL show a normal desmosome in WT compared with a loose desmosome in KO. G: Quantification of the intercellular distance at desmosomes after BDL in WT versus KO shows a significantly greater average distance in KO (average distance KO = 32.6 nm, WT = 23.2 nm). *P < 0.05, **P < 0.01. DP, desmoplakin; Dsc, desmocollin; Dsg, desmoglein; GAPDH, glyceraldehyde-3-phosphate dehydrogenase; HV, high voltage; Mag, magnification.
Figure 5
Figure 5
Enhanced liver tumors in γ-catenin knockout (KO) mice after diethylnitrosamine (DEN) exposure. A: Scheme depicting DEN-induced carcinogenesis protocol used in the study. B: Gross images of livers showing macroscopic tumor nodules in 9-month-old KO and wild-type (WT) livers that were given a single injection of DEN at postnatal day 15. C: Representative hematoxylin and eosin (H&E) images from DEN-treated KO and WT livers showing microscopic tumor nodules. D: Quantification of macroscopic nodules shows a significantly higher tumor burden in KO compared with WT after DEN (average: KO = 12.2, WT = 4.3). E: Quantification of microscopic nodules shows significantly more foci in KO livers after DEN injection compared with WT (average: KO = 19.8, WT = 8). F: Representative immunohistochemical staining for Ki-67 shows notably more positive cells in both tumor tissue and adjacent hepatic tissue in KO compared with WT. G: Quantification of Ki-67 staining shows significantly more positive cells in both tumor and adjacent tissue in KO compared with WT (average in tumor: KO = 76.4, WT = 36.5; average in adjacent tissue: KO = 18, WT = 4.8). *P < 0.05, **P < 0.01, and ***P < 0.001. Original magnification, ×50 (C).
Figure 6
Figure 6
Enhanced tumor development in γ-catenin knockout (KO) exposed to diethylnitrosamine (DEN) is partially because of greater β-catenin activation. A: Immunohistochemistry (IHC) for γ-catenin shows reduced staining in tumor nodules in wild-type (WT) livers compared with adjacent liver, whereas tumors and adjacent liver are completely negative in KO. IHC for β-catenin shows tumor to be composed of cells with membranous β-catenin only. However, a notable heterogeneity is evident in tumors observed in KO, with a subset of tumors composed of cells with clear cytoplasmic and nuclear β-catenin and others with predominant membranous β-catenin. B: IHC for glutamine synthetase (GS) shows no GS-positive nodules in WT or KO livers. However, IHC for cyclin-D1 shows equally strong staining in nodules in both KO and WT livers. C: Real-time PCR shows a significant increase in mRNA expression of axin-2, cyclin-D1, and GS in DEN-treated, tumor-bearing KO compared with DEN-treated, tumor-bearing WT livers. D: Representative immunoprecipitation (IP) of β-catenin and T-cell factor (TCF) 4 in whole cell lysates of baseline WT and KO livers shows a notable increase in association with DEN-treated, tumor-bearing KO compared with DEN-treated, tumor-bearing WT livers. **P < 0.01, ****P < 0.0001. WB, Western blot.
Figure 7
Figure 7
In vitro suppression of γ-catenin in hepatocellular cancer cells leads to enhanced β-catenin activity. A: Representative Western blot (WB) shows successful knockdown of γ-catenin at 48 hours after γ-catenin siRNA (siG) compared with negative control siRNA (siN) transfection of Hep3B cells. A notable increase in β-catenin levels was evident in siG-transfected cells. B: MTT assay shows increased Hep3B cell viability at 48 hours after siG transfection compared with siN. C: TopFlash assay shows a significant increase in T-cell factor (TCF) activity in Hep3B cells at 48 hours after siG transfection (ratio of firefly/Renilla: siG = 0.97, siN = 0.17). D: Representative immunoprecipitation (IP) shows increased association of β-catenin and TCF4 in Hep3B cells after 48 hours of siG transfection compared with siN. γ-Catenin–TCF4 association is evident basally in siN-transfected Hep3B cells, which is abrogated after 48 hours’ transfection with siG. E: Real-time PCR shows a significant increase in mRNA expression of c-Myc, regucalcin, and cyclin-D1 (Cnnd1) in Hep3B cells in the siG-transfected group. P < 0.05, ∗∗P < 0.01, and ∗∗∗P < 0.001. GAPDH, glyceraldehyde-3-phosphate dehydrogenase.
Figure 8
Figure 8
Overexpression of γ-catenin in hepatocellular cancer cells suppresses β-catenin activity to reduce cell viability and proliferation. A: Representative Western blot (WB) shows the efficiency of γ-catenin plasmid (Jup) transfection (1000 ng, 48 hours) compared with pcDNA plasmid only. A notable decrease in β-catenin protein is evident in Jup-transfected cells. B: MTT assay shows a significant decrease in viability of Hep3B cells at 24, 48, and 72 hours after Jup overexpression. C: MTT assay shows decreased viability of Snu-398 cells after γ-catenin plasmid transfection at 48 hours. D: Thymidine incorporation assay shows decreased cell proliferation in γ-catenin plasmid transfection group compared with pcDNA group in Snu-398 cells. E: TopFlash assay shows increased T-cell factor (TCF) activity in Hep3B cells after Jup overexpression at 48 hours (ratio of firefly/Renilla: pcDNA = 0.25, JUP = 1.84). F: TopFlash assay shows increased TCF4 activity in Snu-398 cells after γ-catenin plasmid transfection at 48 hours (ratio of firefly/Renilla: pcDNA 1 μg = 17.8, JUP 1 μg = 23.9). G: Real-time PCR shows a significant decrease in mRNA expression of cyclin-D1 (Cnnd1), c-Myc, and regucalcin in Hep3B cells at 48 hours after Jup overexpression. H: Real-time PCR shows a significant increase in mRNA expression of 14-3-3σ and nonmetastatic protein 23 H1 (Nm-23H1) in Hep3B cells at 48 hours after γ-catenin plasmid transfection. However, Hep3B cells transfected with β-catenin plasmid cause a modest increase in 14-3-3σ but no change in Nm-23H1 mRNA levels. I: Representative immunoprecipitation (IP) shows loss of β-catenin–TCF4 association after Jup overexpression at 48 hours in Hep3B, whereas there is a concomitant increase in γ-catenin–TCF4 association in these cells at the same time. *P < 0.05, **P < 0.01, ***P < 0.001, and ****P < 0.0001. GAPDH, glyceraldehyde-3-phosphate dehydrogenase.

References

    1. Delva E., Tucker D.K., Kowalczyk A.P. The desmosome. Cold Spring Harb Perspect Biol. 2009;1:a002543. - PMC - PubMed
    1. Bierkamp C., Schwarz H., Huber O., Kemler R. Desmosomal localization of beta-catenin in the skin of plakoglobin null-mutant mice. Development. 1999;126:371–381. - PubMed
    1. Wickline E.D., Awuah P.K., Behari J., Ross M., Stolz D.B., Monga S.P. Hepatocyte gamma-catenin compensates for conditionally deleted beta-catenin at adherens junctions. J Hepatol. 2011;55:1256–1262. - PMC - PubMed
    1. Wickline E.D., Du Y., Stolz D.B., Kahn M., Monga S.P. gamma-Catenin at adherens junctions: mechanism and biologic implications in hepatocellular cancer after beta-catenin knockdown. Neoplasia. 2013;15:421–434. - PMC - PubMed
    1. Tan X., Behari J., Cieply B., Michalopoulos G.K., Monga S.P. Conditional deletion of beta-catenin reveals its role in liver growth and regeneration. Gastroenterology. 2006;131:1561–1572. - PubMed

Publication types

MeSH terms