

A refined genome-scale reconstruction of Chlamydomonas metabolism provides a platform for systems-level analyses
- PMID: 26485611
- PMCID: PMC4715634
- DOI: 10.1111/tpj.13059
A refined genome-scale reconstruction of Chlamydomonas metabolism provides a platform for systems-level analyses
Abstract
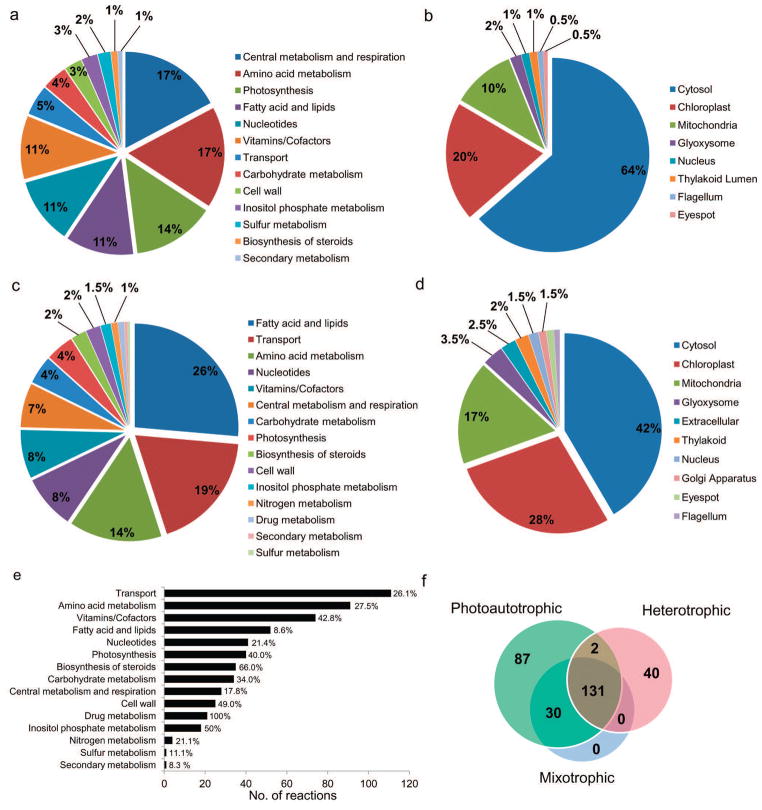
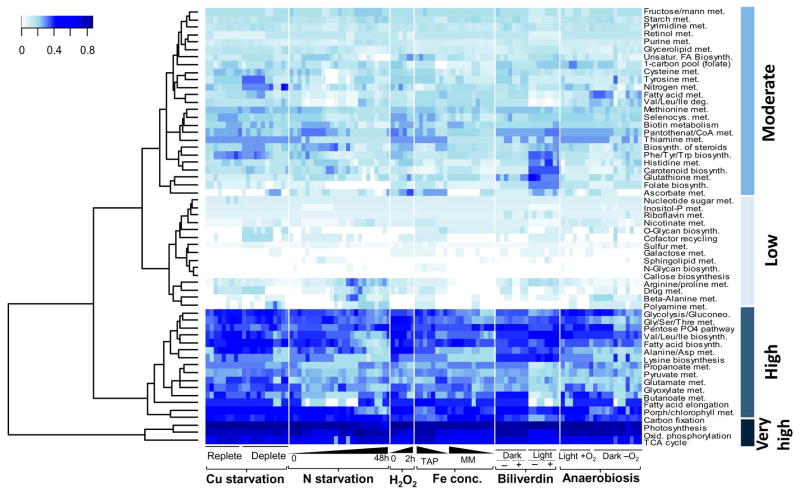
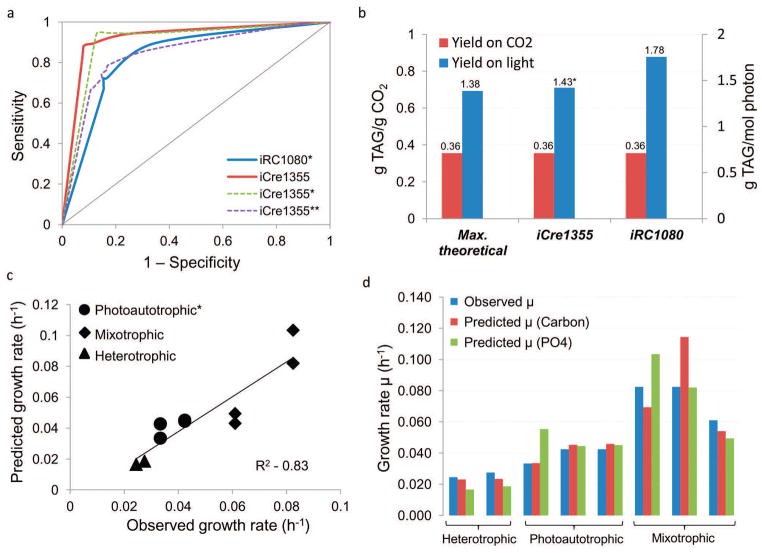
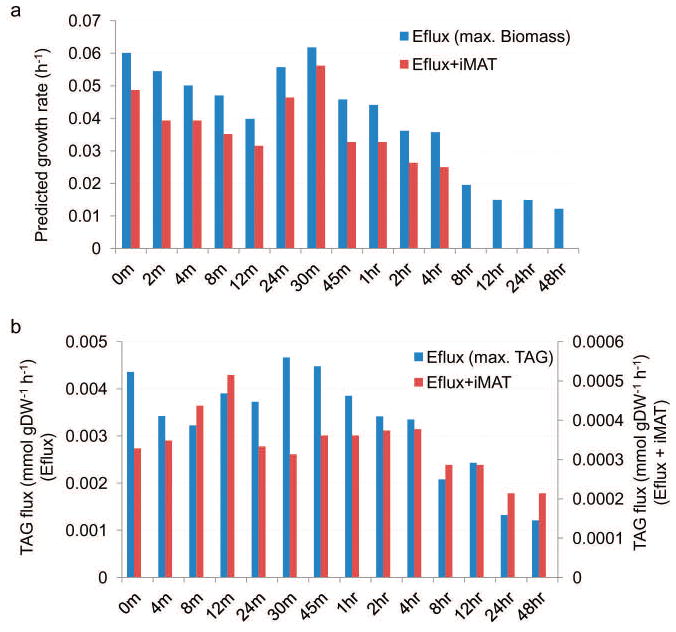
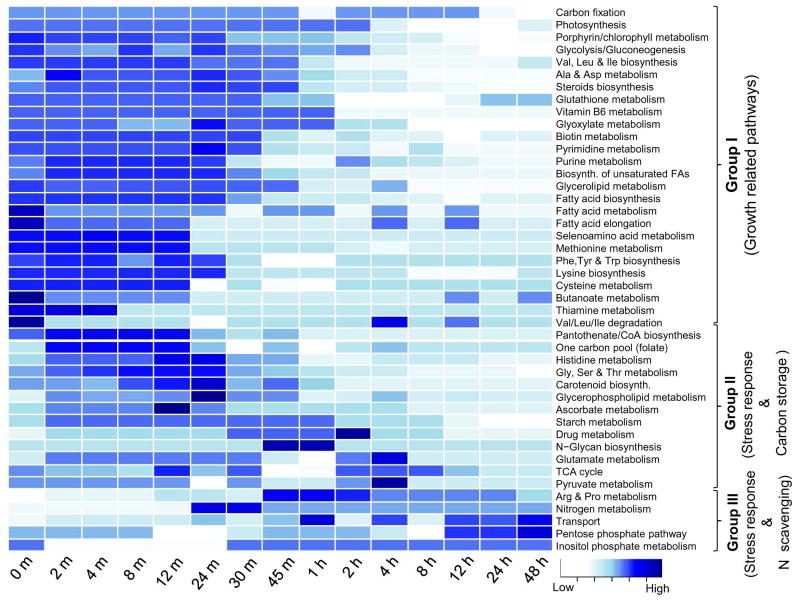
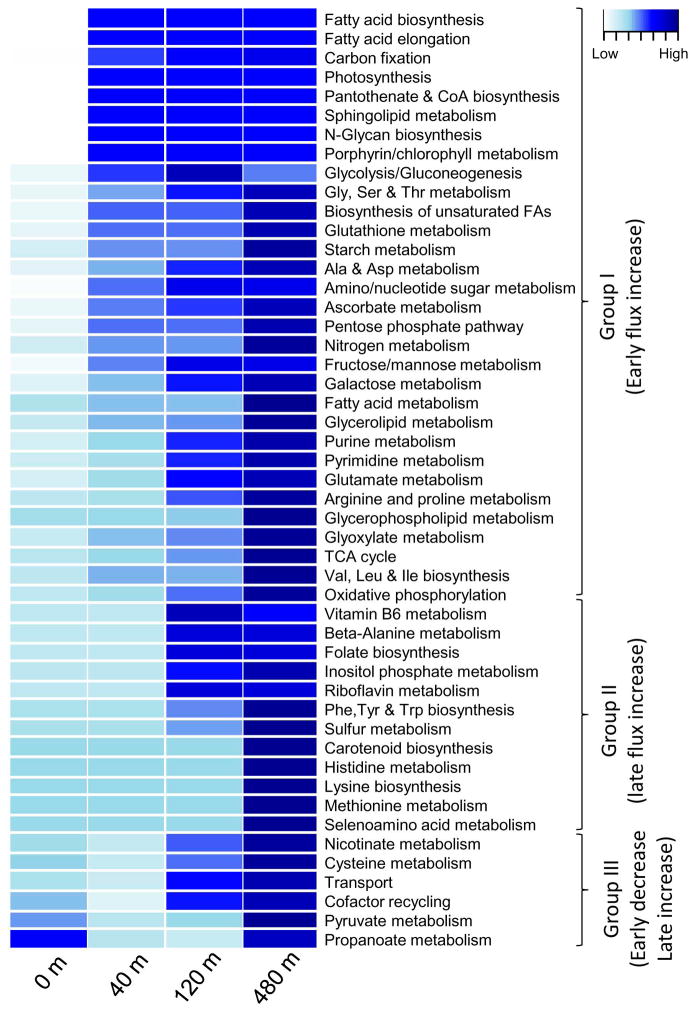
Microalgae have reemerged as organisms of prime biotechnological interest due to their ability to synthesize a suite of valuable chemicals. To harness the capabilities of these organisms, we need a comprehensive systems-level understanding of their metabolism, which can be fundamentally achieved through large-scale mechanistic models of metabolism. In this study, we present a revised and significantly improved genome-scale metabolic model for the widely-studied microalga, Chlamydomonas reinhardtii. The model, iCre1355, represents a major advance over previous models, both in content and predictive power. iCre1355 encompasses a broad range of metabolic functions encoded across the nuclear, chloroplast and mitochondrial genomes accounting for 1355 genes (1460 transcripts), 2394 and 1133 metabolites. We found improved performance over the previous metabolic model based on comparisons of predictive accuracy across 306 phenotypes (from 81 mutants), lipid yield analysis and growth rates derived from chemostat-grown cells (under three conditions). Measurement of macronutrient uptake revealed carbon and phosphate to be good predictors of growth rate, while nitrogen consumption appeared to be in excess. We analyzed high-resolution time series transcriptomics data using iCre1355 to uncover dynamic pathway-level changes that occur in response to nitrogen starvation and changes in light intensity. This approach enabled accurate prediction of growth rates, the cessation of growth and accumulation of triacylglycerols during nitrogen starvation, and the temporal response of different growth-associated pathways to increased light intensity. Thus, iCre1355 represents an experimentally validated genome-scale reconstruction of C. reinhardtii metabolism that should serve as a useful resource for studying the metabolic processes of this and related microalgae.
Keywords: Chlamydomonas reinhardtii; constraint-based analysis; flux balance analysis; lipid accumulation; metabolic modeling; photosynthesis; systems biology.
© 2015 The Authors The Plant Journal © 2015 John Wiley & Sons Ltd.
Figures
Similar articles
-
Flux balance analysis of primary metabolism in Chlamydomonas reinhardtii.BMC Syst Biol. 2009 Jan 7;3:4. doi: 10.1186/1752-0509-3-4. BMC Syst Biol. 2009. PMID: 19128495 Free PMC article.
-
Cyclic decomposition explains a photosynthetic down regulation for Chlamydomonas reinhardtii.Biosystems. 2017 Dec;162:119-127. doi: 10.1016/j.biosystems.2017.09.014. Epub 2017 Sep 29. Biosystems. 2017. PMID: 28970020 Free PMC article.
-
Metabolic network reconstruction of Chlamydomonas offers insight into light-driven algal metabolism.Mol Syst Biol. 2011 Aug 2;7:518. doi: 10.1038/msb.2011.52. Mol Syst Biol. 2011. PMID: 21811229 Free PMC article.
-
Modelling metabolism of the diatom Phaeodactylum tricornutum.Biochem Soc Trans. 2015 Dec;43(6):1182-6. doi: 10.1042/BST20150152. Biochem Soc Trans. 2015. PMID: 26614658 Review.
-
Transgene Expression in Microalgae-From Tools to Applications.Front Plant Sci. 2016 Apr 22;7:505. doi: 10.3389/fpls.2016.00505. eCollection 2016. Front Plant Sci. 2016. PMID: 27148328 Free PMC article. Review.
Cited by
-
Current status and applications of genome-scale metabolic models.Genome Biol. 2019 Jun 13;20(1):121. doi: 10.1186/s13059-019-1730-3. Genome Biol. 2019. PMID: 31196170 Free PMC article. Review.
-
An adjustable algal chloroplast plug-and-play model for genome-scale metabolic models.PLoS One. 2020 Feb 24;15(2):e0229408. doi: 10.1371/journal.pone.0229408. eCollection 2020. PLoS One. 2020. PMID: 32092117 Free PMC article.
-
Transcriptional program for nitrogen starvation-induced lipid accumulation in Chlamydomonas reinhardtii.Biotechnol Biofuels. 2015 Dec 2;8:207. doi: 10.1186/s13068-015-0391-z. eCollection 2015. Biotechnol Biofuels. 2015. PMID: 26633994 Free PMC article.
-
Inferring Biochemical Reactions and Metabolite Structures to Understand Metabolic Pathway Drift.iScience. 2020 Feb 21;23(2):100849. doi: 10.1016/j.isci.2020.100849. Epub 2020 Jan 17. iScience. 2020. PMID: 32058961 Free PMC article.
-
A high throughput array microhabitat platform reveals how light and nitrogen colimit the growth of algal cells.Sci Rep. 2024 Apr 29;14(1):9860. doi: 10.1038/s41598-024-59041-3. Sci Rep. 2024. PMID: 38684720 Free PMC article.
References
-
- Alper H, Jin YS, Moxley JF, Stephanopoulos G. Identifying gene targets for the metabolic engineering of lycopene biosynthesis in Escherichia coli. Metab Eng. 2005;7:155–164. - PubMed
-
- Atteia A, Adrait A, Brugiere S, Tardif M, van Lis R, Deusch O, Dagan T, Kuhn L, Gontero B, Martin W, Garin J, Joyard J, Rolland N. A proteomic survey of Chlamydomonas reinhardtii mitochondria sheds new light on the metabolic plasticity of the organelle and on the nature of the alpha-proteobacterial mitochondrial ancestor. Mol Biol Evol. 2009;26:1533–1548. - PubMed
-
- Bishop CL, Purton S, Nugent JH. Molecular analysis of the Chlamydomonas nuclear gene encoding PsbW and demonstration that PsbW is a subunit of photosystem II, but not photosystem I. Plant Mol Biol. 2003;52:285–289. - PubMed
-
- Blaby IK, Blaby-Haas CE, Tourasse N, Hom EF, Lopez D, Aksoy M, Grossman A, Umen J, Dutcher S, Porter M, King S, Witman GB, Stanke M, Harris EH, Goodstein D, Grimwood J, Schmutz J, Vallon O, Merchant SS, Prochnik S. The Chlamydomonas genome project: a decade on. Trends Plant Sci. 2014;19:672–680. - PMC - PubMed
Publication types
MeSH terms
Grants and funding
LinkOut - more resources
Full Text Sources
Other Literature Sources
