

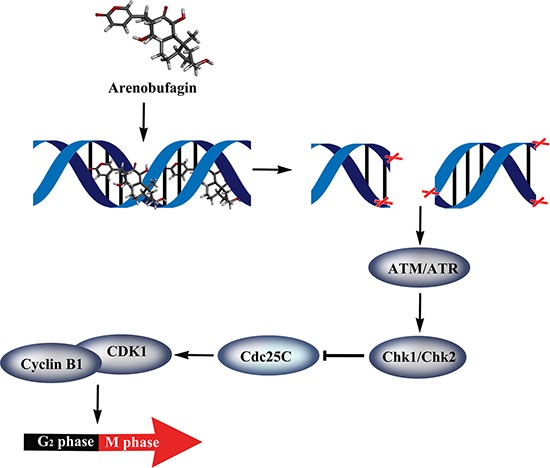
Arenobufagin intercalates with DNA leading to G2 cell cycle arrest via ATM/ATR pathway
- PMID: 26485758
- PMCID: PMC4741450
- DOI: 10.18632/oncotarget.5545
Arenobufagin intercalates with DNA leading to G2 cell cycle arrest via ATM/ATR pathway
Abstract
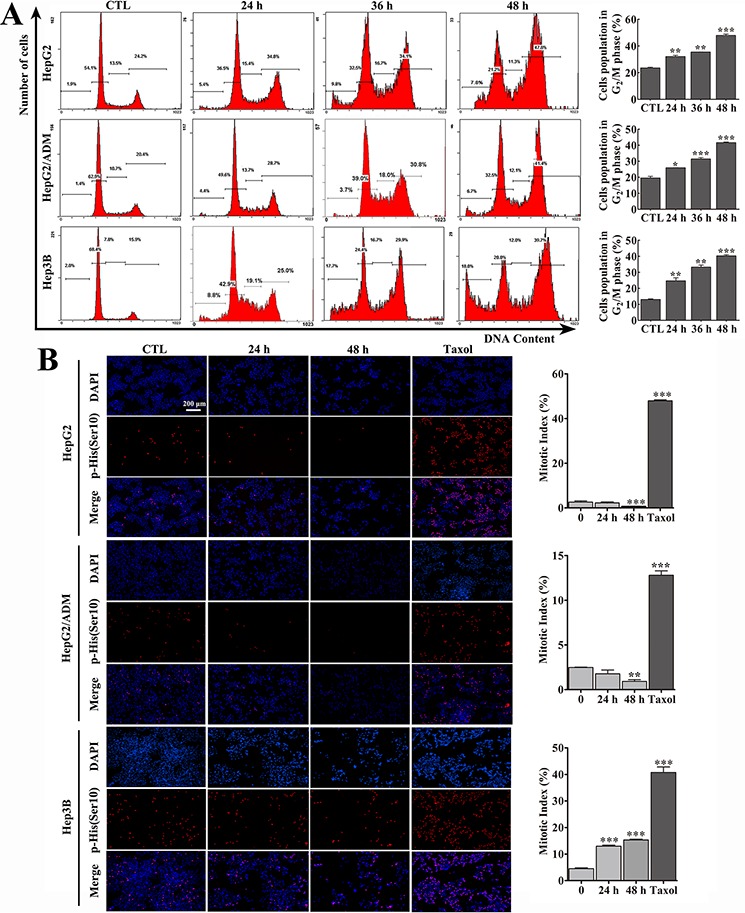
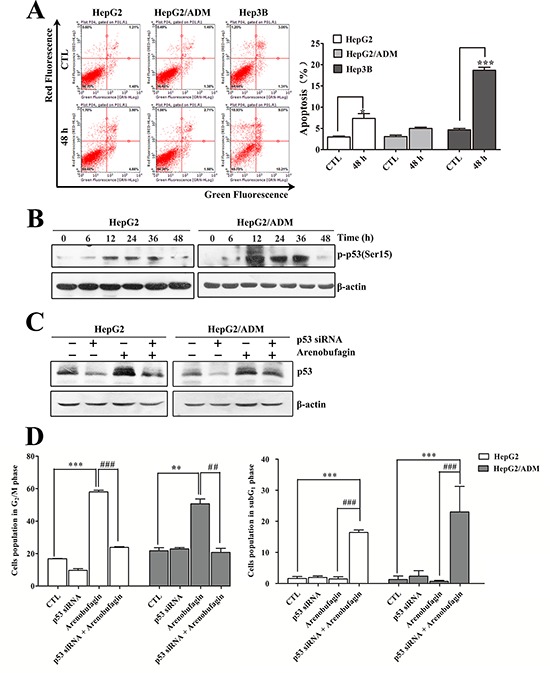
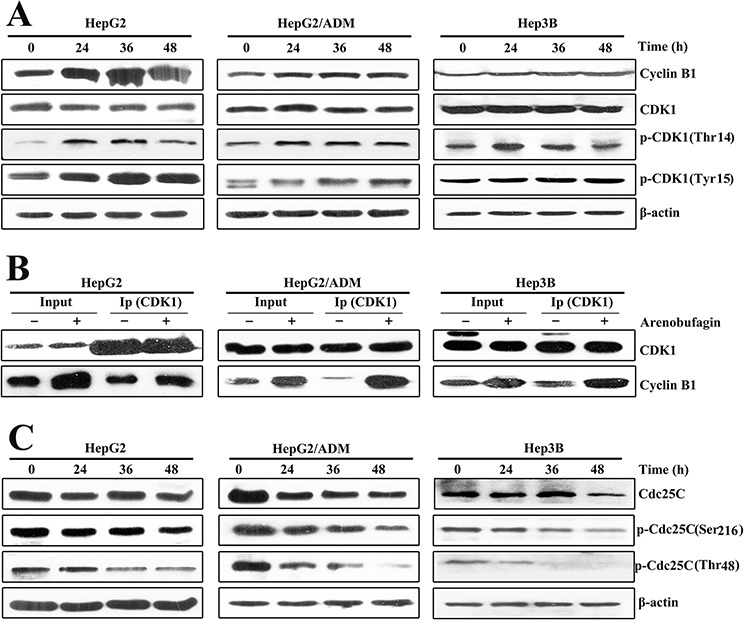
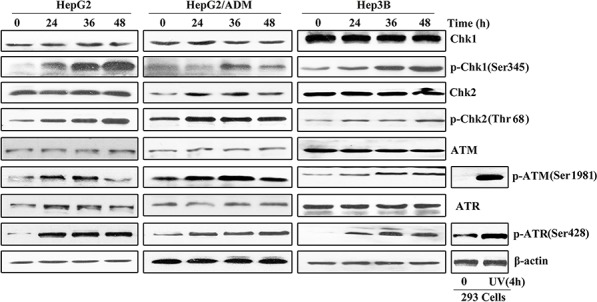
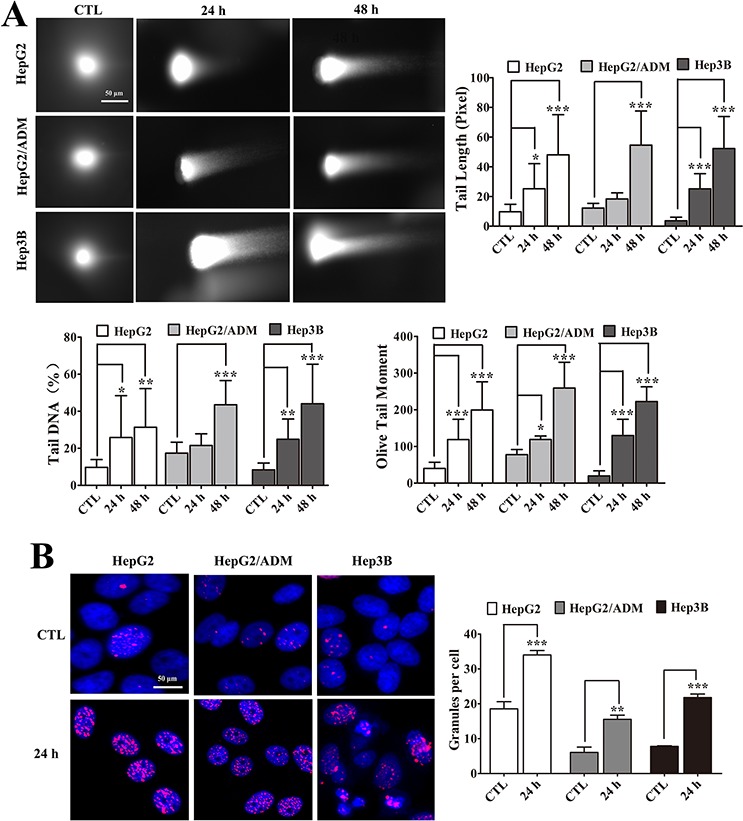
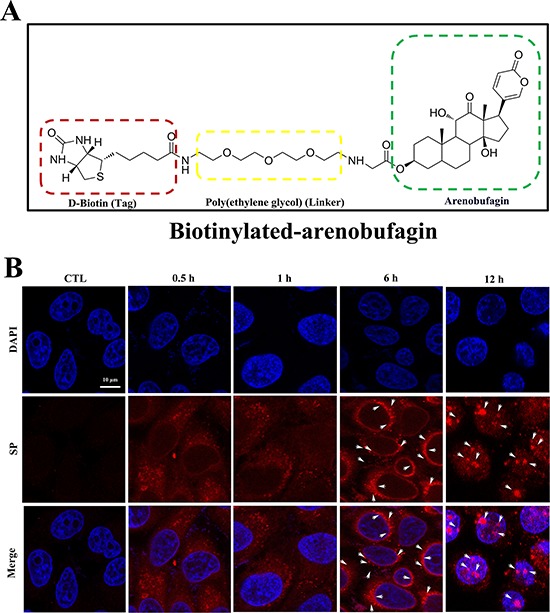
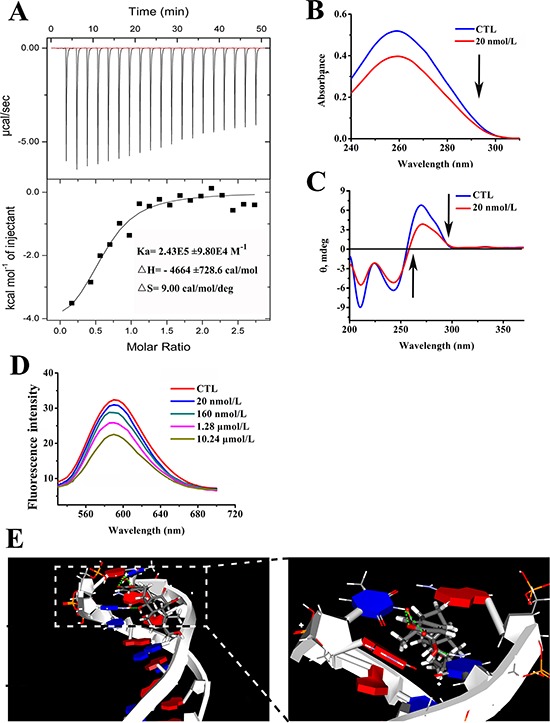
Arenobufagin, a representative bufadienolide, is the major active component in the traditional Chinese medicine Chan'su. It possesses significant antineoplastic activity in vitro. Although bufadienolide has been found to disrupt the cell cycle, the underlying mechanisms of this disruption are not defined. Here, we reported that arenobufagin blocked the transition from G2 to M phase of cell cycle through inhibiting the activation of CDK1-Cyclin B1 complex; The tumor suppressor p53 contributed to sustaining arrest at the G2 phase of the cell cycle in hepatocellular carcinoma (HCC) cells. Moreover, arenobufagin caused double-strand DNA breaks (DSBs) and triggered the DNA damage response (DDR), partly via the ATM/ATR-Chk1/Chk2-Cdc25C signaling pathway. Importantly, we used a synthetic biotinylated arenobufagin-conjugated chemical probe in live cells to show that arenobufagin accumulated mainly in the nucleus. The microscopic thermodynamic parameters measured using isothermal titration calorimetry (ITC) also demonstrated that arenobufagin directly bound to DNA in vitro. The hypochromicity in the UV-visible absorption spectrum, the significant changes in the circular dichroism (CD) spectrum of DNA, and the distinct quenching in the fluorescence intensity of the ethidium bromide (EB)-DNA system before and after arenobufagin treatment indicated that arenobufagin bound to DNA in vitro by intercalation. Molecular modeling suggested arenobufagin intercalated with DNA via hydrogen bonds between arenobufagin and GT base pairs. Collectively, these data provide novel insights into arenobufagin-induced cell cycle disruption that are valuable for the further discussion and investigation of the use of arenobufagin in clinical anticancer chemotherapy.
Keywords: DNA damage response; DNA intercalator; G2 cell cycle arrest; arenobufagin.
Conflict of interest statement
All authors declare no conflicts of interest.
Figures

References
-
- Anestopoulos I, Voulgaridou GP, Georgakilas AG, Franco R, Pappa A, Panayiotidis MI. Epigenetic therapy as a novel approach in hepatocellular carcinoma. Pharmacology & Therapeutics. 2015;145:103–119. - PubMed
-
- Llovet JM, Ricci S, Mazzaferro V, Hilgard P, Gane E, Blanc JF, de Oliveira AC, Santoro A, Raoul JL, Forner A, Schwartz M Porta C, Zeuzem S, Bolondi L, et al. Sorafenib in advanced hepatocellular carcinoma. N Engl J Med. 2008;359:378–390. - PubMed
-
- Clarke BT. The natural history of amphibian skin secretions, their normal functioning and potential medical applications. Biol Rev Camb Philos Soc. 1997;72:365–379. - PubMed
Publication types
MeSH terms
Substances
LinkOut - more resources
Full Text Sources
Other Literature Sources
Medical
Molecular Biology Databases
Research Materials
Miscellaneous
