. 2015 Oct;27(10):2894-906.
doi: 10.1105/tpc.15.00607. Epub 2015 Oct 20.

GLABRA2 Directly Suppresses Basic Helix-Loop-Helix Transcription Factor Genes with Diverse Functions in Root Hair Development

Affiliations

GLABRA2 Directly Suppresses Basic Helix-Loop-Helix Transcription Factor Genes with Diverse Functions in Root Hair Development

Qing Lin et al. Plant Cell. 2015 Oct.

Abstract

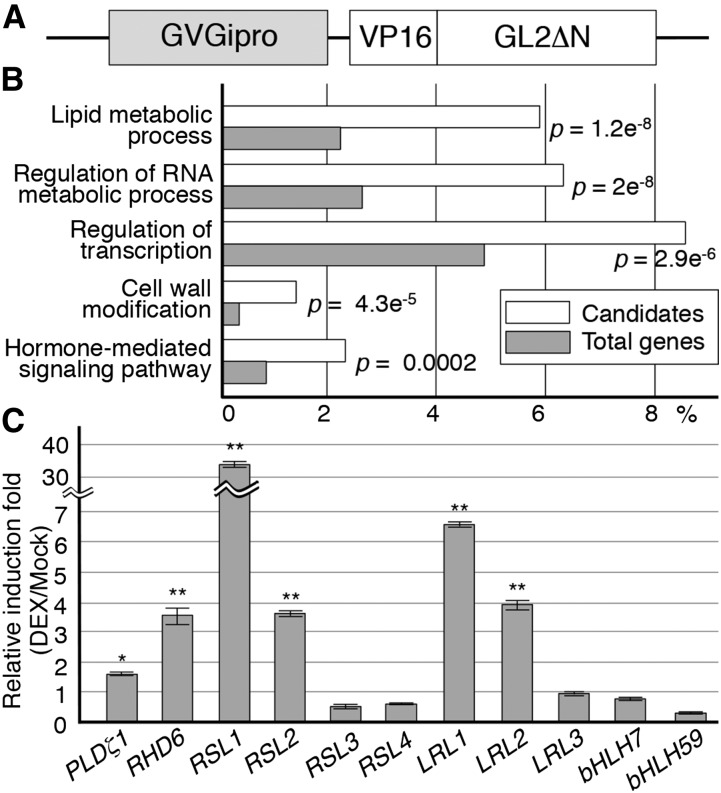
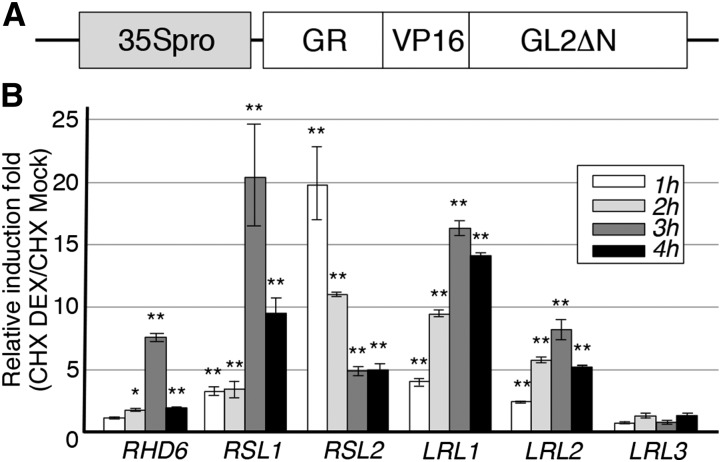
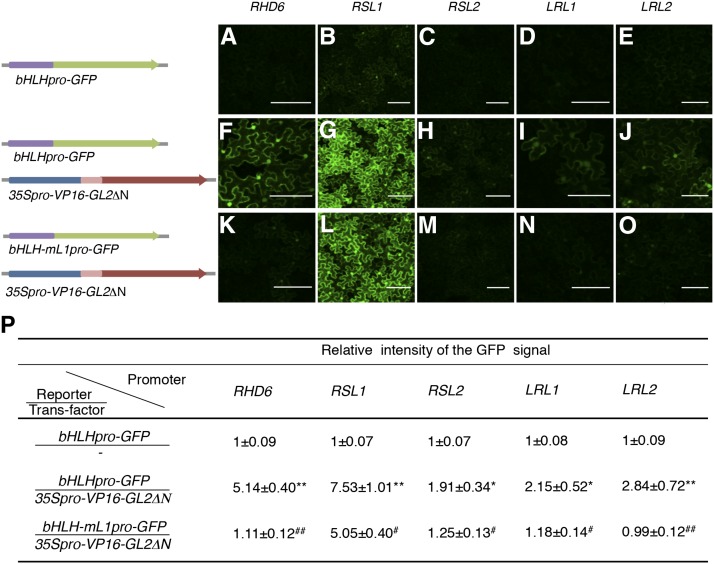
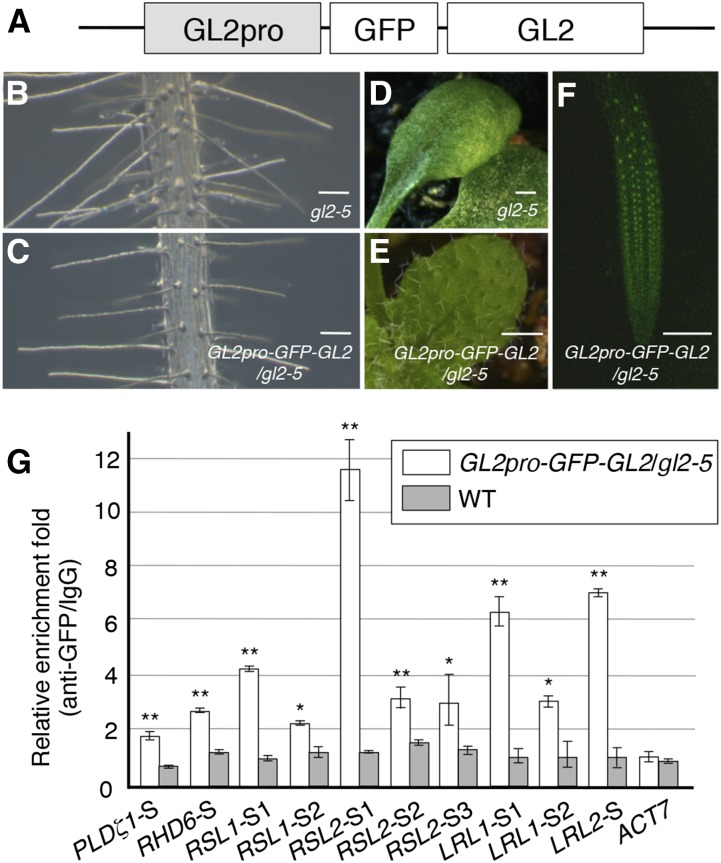
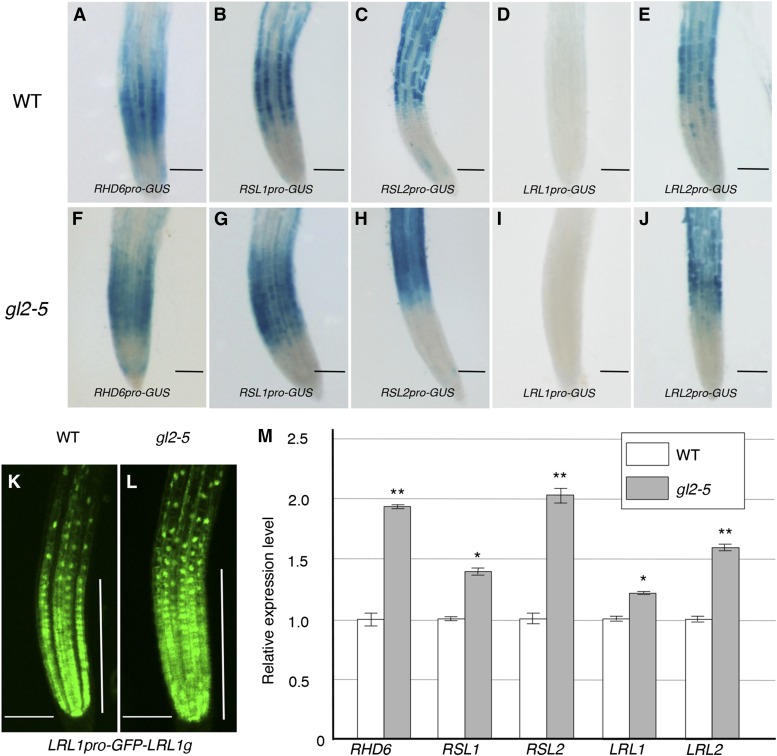
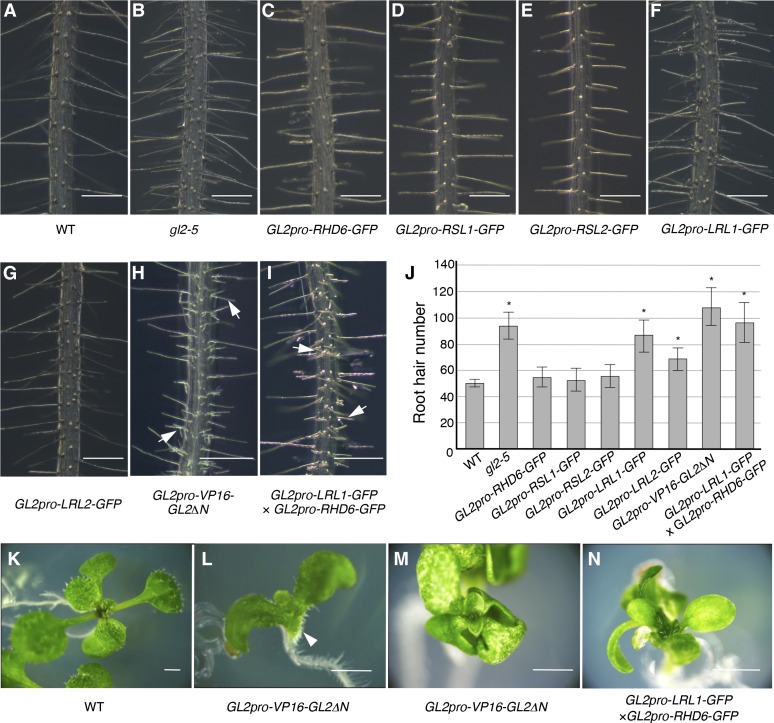
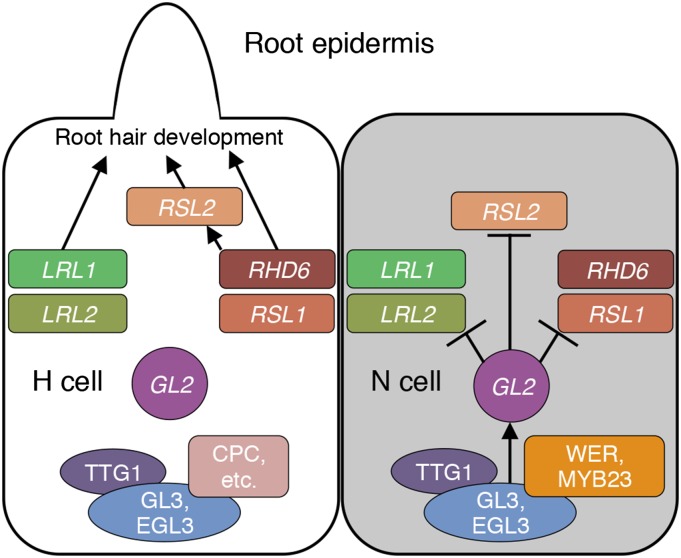
The Arabidopsis thaliana GLABRA2 (GL2) gene encodes a transcription factor involved in the cell differentiation of various epidermal tissues. During root hair pattern formation, GL2 suppresses root hair development in non-hair cells, acting as a node between the gene regulatory networks for cell fate determination and cell differentiation. Despite the importance of GL2 function, its molecular basis remains obscure because the GL2 target genes leading to the network for cell differentiation are unknown. We identified five basic helix-loop-helix (bHLH) transcription factor genes (ROOT HAIR DEFECTIVE6 [RHD6], RHD6-LIKE1 [RSL1], RSL2, Lj-RHL1-LIKE1 [LRL1], and LRL2) as GL2 direct targets using transcriptional and posttranslational induction systems. Chromatin immunoprecipitation analysis confirmed GL2 binding to upstream regions of these genes in planta. Reporter gene analyses showed that these genes are expressed in various stages of root hair development and are suppressed by GL2 in non-hair cells. GL2 promoter-driven GFP fusions of LRL1 and LRL2, but not those of the other bHLH proteins, conferred root hair development on non-hair cells. These results indicate that GL2 directly suppresses bHLH genes with diverse functions in root hair development.


Figures

Figure 1.
Figure 1.
Microarray and Individual Expression Analyses for Candidate GL2 Target Genes. (A) The structure of the modified GL2 gene (GVGipro-VP16-GL2ΔN) used in the expression analyses for candidate GL2 target genes is schematically illustrated. The promoter is glucocorticoid inducible via the function of the GVG transcription factor. (B) The candidate target genes obtained from the microarray analysis were categorized by gene product functions as defined using the agriGO Web-based software tool (Du et al., 2010), and the top five groups with most significant enrichment are shown with the ratios of their populations in the candidates (white box) and the total Arabidopsis genes (gray box). P values are indicated on the right of boxes. (C) Relative induction folds (DEX/Mock) of transcript levels in the expression analysis for individual bHLH VIIIc and XI subfamily genes, and the PLDζ1 gene as a positive control, are shown (mean ± sd, n = 3). Asterisks indicate significant differences between the levels of the DEX and mock samples (*P < 0.05 and **P < 0.01, Student’s t test).
Figure 2.
Figure 2.
GL2 Direct Target Analysis of the Candidate GL2 Target Genes. (A) The structure of the modified GL2 gene with a posttranslationally inducible function (35Spro-GR-VP16-GL2ΔN) used in the GL2 direct target analysis is schematically illustrated. (B) Results of the inducible expression analysis using 35Spro-GR-VP16-GL2ΔN are shown for the candidate GL2 target genes RHD6, RSL1, RSL2, LRL1, and LRL2 and a negative control gene, LRL3. Relative induction folds (CHX DEX/CHX Mock) of transcript levels 1 to 4 h after induction are presented by different gray colors (mean ± sd, n = 3). Asterisks indicate significant differences between the levels of the CHX-DEX and CHX-Mock samples (*P < 0.05 and **P < 0.01, Student’s t test).
Figure 3.
Figure 3.
Transient Expression Analysis for the Promoter Activity Directed by VP16-GL2ΔN. (A) to (O) Representative fluorescence images of the N. benthamiana leaf epidermis transfected with each bHLH promoter-driven GFP gene, bHLHpro-GFP ([A] to [E]), each bHLHpro-GFP and the transfactor gene 35Spro-VP16-GL2ΔN ([F] to [J]), or each mutant bHLH promoter-driven GFP gene, bHLH-mL1pro-GFP, and 35Spro-VP16-GL2ΔN ([K] to [O]) are shown. The structures of the genes are schematically illustrated on the left of the images. The L1 box-like sequence 5′-TAAATGT-3′ was altered to 5′-TACATCT-3′ at all sites in each mutant bHLH promoter. Bars = 100 μm. (P) Intensities of the GFP fluorescence signal were quantified, and the relative intensity of the signal was calculated with the mean value for each bHLHpro-GFP arbitrarily set as 1 (mean ± sd, n = 3). Asterisks indicate that the values are significantly different from their corresponding bHLHpro-GFP values (*P < 0.05 and **P < 0.01, Student’s t test). Hashes indicate that the values are significantly different from their corresponding bHLHpro-GFP/35Spro-VP16-GL2ΔN values (#P < 0.05 and ##P < 0.01, Student’s t test).
Figure 4.
Figure 4.
ChIP Analysis for the Binding of GL2 to the GL2 Target Genes. (A) The structure of the GL2 promoter-driven GFP-GL2 gene (GL2pro-GFP-GL2) used in the ChIP analysis is schematically illustrated. (B) to (E) Phenotypes in the root ([B] and [C]) and leaf ([D] and [E]) epidermis of the gl2-5 mutant ([B] and [D]) and GL2pro-GFP-GL2/gl2-5 transgenic ([C] and [E]) plants are shown. (F) The GFP fluorescence signal in a root tip region of the GL2pro-GFP-GL2/gl2-5 transgenic plant is shown. Bars = 100 μm in (B), (C), and (F) and 500 μm in (D) and (E). (G) Results of the ChIP analysis are shown. The quantified DNA regions PLDζ1-S, RHD6-S, RSL1-S1, RSL1-S2, RSL2-S1, RSL2-S2, RSL2-S3, LRL1-S1, LRL1-S2, and LRL2-S correspond to the sites of the L1 box-like sequence listed in Table 2. The regions RSL2-S3 and LRL2-S1 contain two sites of the L1 box-like sequence for each. An upstream DNA region of ACT7 was used as a negative control. Relative enrichment folds (anti-GFP/IgG) of GL2pro-GFP-GL2/gl2-5 roots and the wild-type roots are shown in white and gray boxes, respectively (mean ± sd, n = 3). Asterisks indicate significant differences between the enrichment folds in GL2-pro-GFP-GL2/gl2-5 and in the wild type (*P < 0.05 and **P < 0.01, Student’s t test).
Figure 5.
Figure 5.
Expression Analyses of the GL2 Target Genes. (A) to (J) Histochemical GUS expression patterns in root tips at 7 d after germination (DAG) in the wild-type ([A] to [E]) and gl2-5 ([F] to [J]) genetic backgrounds are shown for the upstream regions of RHD6 ([A] and [F]), RSL1 ([B] and [G]), RSL2 ([C] and [H]), LRL1 ([D] and [I]), and LRL2 ([E] and [J]). (K) and (L) The GFP fluorescence signal directed by the GFP reporter gene containing the upstream and total genomic regions of LRL1 (LRL1pro-GFP-LRL1g) is shown. Root tips of the 7-DAG transgenic plants harboring LRL1pro-GFP-LRL1g in the wild-type (K) and gl2-5 (L) genetic backgrounds were observed. Vertical bars indicate the root tip region containing proliferating cells. Bars = 100 μm in (A) to (L). (M) Relative transcript levels of RHD6, RSL1, RSL2, LRL1, and LRL2 in 7-DAG wild-type (white box) and gl2-5 (gray box) roots are shown. Transcript levels were determined by qRT-PCR, and their relative values were calculated by setting each wild-type mean value arbitrarily as 1 (mean ± sd, n = 3). Asterisks indicate significant differences between the transcript levels in gl2-5 and in the wild type (*P < 0.05 and **P < 0.01, Student’s t test).
Figure 6.
Figure 6.
Root Hair Phenotypes of gl2-5, lrl1-2, lrl2-2, and Their Multiple Mutants. (A) to (J) Main roots of the wild type (A), lrl1-2 (B), lrl2-2 (C), lrl1-2 lrl2-2/+ (D), lrl1-2/+ lrl2-2 (E), gl2-5 (F), gl2-5 lrl1-2 (G), gl2-5 lrl2-2 (H), gl2-5 lrl1-2 lrl2-2/+ (I), and gl2-5 lrl1-2/+ lrl2-2 (J) at 7 DAG are shown. Bars = 500 μm in (A) to (J). (K) Root hair lengths of the wild type, gl2-5, lrl1-2, lrl2-2, and their multiple mutants at 7 DAG are shown. Root hairs in the region 5 to 7 mm away from the root tip were measured (mean ± sd, n = 400). Asterisks indicate that the root hair lengths are significantly different from those of the wild type (*P < 0.05 and **P < 0.01, Student’s t test). Hashes indicate that the root hair lengths are significantly different from those of gl2-5 (#P < 0.05 and ##P < 0.01, Student’s t test). (L) Root hair numbers of the wild type, gl2-5, lrl1-2, lrl2-2, and their multiple mutants at 7 DAG are shown. Root hairs and bulges in the visible side in the region 5 to 7 mm away from the root tip were counted (mean ± sd, n = 10). Asterisks indicate that the root hair numbers are significantly different from those of the wild type (P < 0.01, Student’s t test). Hashes indicate that the root hair numbers are significantly different from those of gl2-5 (P < 0.01, Student’s t test).
Figure 7.
Figure 7.
Phenotypes Caused by the GL2 Promoter-Driven bHLH-GFP Genes. (A) to (I) Main roots of the wild-type (A) and gl2-5 (B) plants and the transgenic plants harboring GL2pro-RHD6-GFP (C), GL2pro-RSL1-GFP (D), GL2pro-RSL2-GFP (E), GL2pro-LRL1-GFP (F), GL2pro-LRL2-GFP (G), GL2pro-VP16-GL2ΔN (H), and both GL2pro-LRL1-GFP and GL2pro-RHD6-GFP (I) at 7 DAG are shown. Typical branching root hair structures are indicated by arrows in (H) and (I). (J) Root hair numbers of the wild-type and gl2-5 roots and the transgenic roots harboring GL2pro-RHD6-GFP, GL2pro-RSL1-GFP, GL2pro-RSL2-GFP, GL2pro-LRL1-GFP, GL2pro-LRL2-GFP, GL2pro-VP16-GL2ΔN, and both GL2pro-LRL1-GFP and GL2pro-RHD6-GFP at 7 DAG are shown (mean ± sd, n = 10). Asterisks indicate that the root hair numbers are significantly different from those of the wild type (P < 0.01, Student’s t test). (K) to (N) Phenotypes of the transgenic seedlings harboring GL2pro-VP16-GL2ΔN and both GL2pro-LRL1-GFP and GL2pro-RHD6-GFP in aerial organs. Seedlings of the wild type (K) and transgenic lines harboring GL2pro-VP16-GL2ΔN ([L] and [M]) and both GL2pro-LRL1-GFP and GL2pro-RHD6-GFP (N) are shown. The root hair-like structures on the abaxial surface of the hypocotyl/cotyledon junction are indicated by an arrowhead in (L). Bars = 250 μm in (A) to (I) and 1 cm in (K) to (N).
Figure 8.
Figure 8.
A Model of the Transcriptional Network Surrounding GL2 in Root Epidermal Cells. In N cells (gray), the WER/MYB23-GL3/EGL3-TTG1 complex activates GL2. GL2 directly suppresses the bHLH transcription factor genes RHD6, RSL1, RSL2, LRL1, and LRL2. In H cells (white), WER and MYB23 in the complex are replaced by CPC and its paralogs. Consequently, GL2 is not activated and the bHLH genes remain active to promote various stages of root hair development. Arrows indicate activation of genes or promotion of root hair development. T-bars indicate suppression of genes.

References

    1. Abe M., Takahashi T., Komeda Y. (2001). Identification of a cis-regulatory element for L1 layer-specific gene expression, which is targeted by an L1-specific homeodomain protein. Plant J. 26: 487–494. - PubMed
    1. Alonso J.M., et al. (2003). Genome-wide insertional mutagenesis of Arabidopsis thaliana. Science 301: 653–657. - PubMed
    1. Aoyama T., Chua N.-H. (1997). A glucocorticoid-mediated transcriptional induction system in transgenic plants. Plant J. 11: 605–612. - PubMed
    1. Bernhardt C., Lee M.M., Gonzalez A., Zhang F., Lloyd A., Schiefelbein J. (2003). The bHLH genes GLABRA3 (GL3) and ENHANCER OF GLABRA3 (EGL3) specify epidermal cell fate in the Arabidopsis root. Development 130: 6431–6439. - PubMed
    1. Bernhardt C., Zhao M., Gonzalez A., Lloyd A., Schiefelbein J. (2005). The bHLH genes GL3 and EGL3 participate in an intercellular regulatory circuit that controls cell patterning in the Arabidopsis root epidermis. Development 132: 291–298. - PubMed

Publication types

MeSH terms

Substances