

From synaptically localized to volume transmission by nitric oxide
- PMID: 26486504
- PMCID: PMC4704503
- DOI: 10.1113/JP270297
From synaptically localized to volume transmission by nitric oxide
Abstract
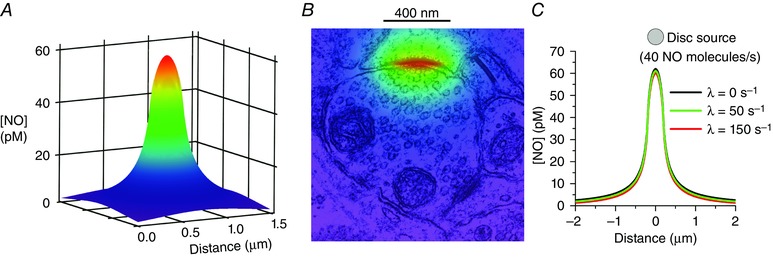
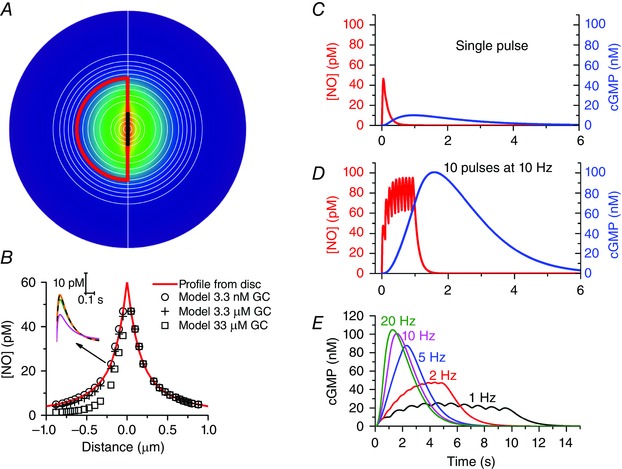
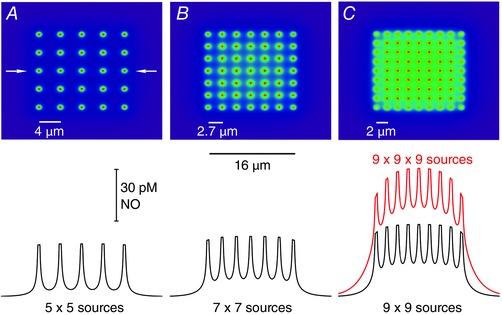
Nitric oxide (NO) functions widely as a transmitter/diffusible second messenger in the central nervous system, exerting physiological effects in target cells by binding to specialized guanylyl cyclase-coupled receptors, resulting in cGMP generation. Despite having many context-dependent physiological roles and being implicated in numerous disease states, there has been a lack of clarity about the ways that NO operates at the cellular and subcellular levels. Recently, several approaches have been used to try to gain a more concrete, quantitative understanding of this unique signalling pathway. These approaches have included analysing the kinetics of NO receptor function, real-time imaging of cellular NO signal transduction in target cells, and the use of ultrasensitive detector cells to record NO as it is being generated from native sources in brain tissue. The current picture is that, when formed in a synapse, NO is likely to act only very locally, probably mostly within the confines of that synapse, and to exist only in picomolar concentrations. Nevertheless, closely neighbouring synapses may also be within reach, raising the possibility of synaptic crosstalk. By engaging its enzyme-coupled receptors, the low NO concentrations are able to stimulate physiological (submicromolar) increases in cGMP concentration in an activity-dependent manner. When many NO-emitting neurones or synapses are active simultaneously in a tissue region, NO can act more like a volume transmitter to influence, and perhaps coordinate, the behaviour of cells within that region, irrespective of their identity and anatomical connectivity.
© 2015 The Authors. The Journal of Physiology © 2015 The Physiological Society.
Figures
Similar articles
-
Nitric oxide and carbon monoxide as possible retrograde messengers in hippocampal long-term potentiation.J Neurobiol. 1994 Jun;25(6):652-65. doi: 10.1002/neu.480250607. J Neurobiol. 1994. PMID: 8071665 Review.
-
Nitric oxide as a multimodal brain transmitter.Brain Neurosci Adv. 2018 Dec 4;2:2398212818810683. doi: 10.1177/2398212818810683. eCollection 2018 Jan-Dec. Brain Neurosci Adv. 2018. PMID: 32166152 Free PMC article. Review.
-
NO/cGMP-dependent modulation of synaptic transmission.Handb Exp Pharmacol. 2008;(184):529-60. doi: 10.1007/978-3-540-74805-2_16. Handb Exp Pharmacol. 2008. PMID: 18064424 Review.
-
The alpha2beta1 isoform of guanylyl cyclase mediates plasma membrane localized nitric oxide signalling.Cell Signal. 2007 Oct;19(10):2183-93. doi: 10.1016/j.cellsig.2007.06.017. Epub 2007 Jun 29. Cell Signal. 2007. PMID: 17643962
-
Sources and targets of nitric oxide signalling in insect nervous systems.Cell Tissue Res. 2001 Feb;303(2):137-46. doi: 10.1007/s004410000321. Cell Tissue Res. 2001. PMID: 11291761 Review.
Cited by
-
Emerging Roles of Endothelial Nitric Oxide in Preservation of Cognitive Health.Stroke. 2023 Mar;54(3):686-696. doi: 10.1161/STROKEAHA.122.041444. Epub 2023 Feb 27. Stroke. 2023. PMID: 36848426 Free PMC article. Review.
-
Roles of Gasotransmitters in Synaptic Plasticity and Neuropsychiatric Conditions.Neural Plast. 2018 May 6;2018:1824713. doi: 10.1155/2018/1824713. eCollection 2018. Neural Plast. 2018. PMID: 29853837 Free PMC article. Review.
-
Connectomics of the Octopus vulgaris vertical lobe provides insight into conserved and novel principles of a memory acquisition network.Elife. 2023 Jul 6;12:e84257. doi: 10.7554/eLife.84257. Elife. 2023. PMID: 37410519 Free PMC article.
-
Localised intracellular signalling in neurons.J Physiol. 2016 Jan 1;594(1):7-8. doi: 10.1113/JP271357. J Physiol. 2016. PMID: 26724480 Free PMC article. No abstract available.
-
Granular Layer Neurons Control Cerebellar Neurovascular Coupling Through an NMDA Receptor/NO-Dependent System.J Neurosci. 2017 Feb 1;37(5):1340-1351. doi: 10.1523/JNEUROSCI.2025-16.2016. Epub 2016 Dec 30. J Neurosci. 2017. PMID: 28039371 Free PMC article.
References
-
- Agnati LF, Guidolin D, Guescini M, Genedani S & Fuxe K (2010). Understanding wiring and volume transmission. Brain Res Rev 64, 137–159. - PubMed
-
- Alagarsamy S, Lonart G & Johnson KM (1994). The role of P‐type calcium channels in the depolarization‐induced activation of nitric oxide synthase in frontal cortex. J Neurochem 62, 400–403. - PubMed
-
- Aoki C, Rhee J, Lubin M & Dawson TM (1997). NMDA‐R1 subunit of the cerebral cortex co‐localizes with neuronal nitric oxide synthase at pre‐ and postsynaptic sites and in spines. Brain Res 750, 25–40. - PubMed
Publication types
MeSH terms
Substances
Grants and funding
LinkOut - more resources
Full Text Sources
Other Literature Sources