

Integrative metabonomics as potential method for diagnosis of thyroid malignancy
- PMID: 26486570
- PMCID: PMC4613561
- DOI: 10.1038/srep14869
Integrative metabonomics as potential method for diagnosis of thyroid malignancy
Abstract
Thyroid nodules can be classified into benign and malignant tumors. However, distinguishing between these two types of tumors can be challenging in clinics. Since malignant nodules require surgical intervention whereas asymptomatic benign tumors do not, there is an urgent need for new techniques that enable accurate diagnosis of malignant thyroid nodules. Here, we used (1)H NMR spectroscopy coupled with pattern recognition techniques to analyze the metabonomes of thyroid tissues and their extracts from thyroid lesion patients (n = 53) and their adjacent healthy thyroid tissues (n = 46). We also measured fatty acid compositions using GC-FID/MS techniques as complementary information. We demonstrate that thyroid lesion tissues can be clearly distinguishable from healthy tissues, and malignant tumors can also be distinguished from the benign tumors based on the metabolic profiles, both with high sensitivity and specificity. In addition, we show that thyroid lesions are accompanied with disturbances of multiple metabolic pathways, including alterations in energy metabolism (glycolysis, lipid and TCA cycle), promotions in protein turnover, nucleotide biosynthesis as well as phosphatidylcholine biosynthesis. These findings provide essential information on the metabolic features of thyroid lesions and demonstrate that metabonomics technology can be potentially useful in the rapid and accurate preoperative diagnosis of malignant thyroid nodules.
Figures
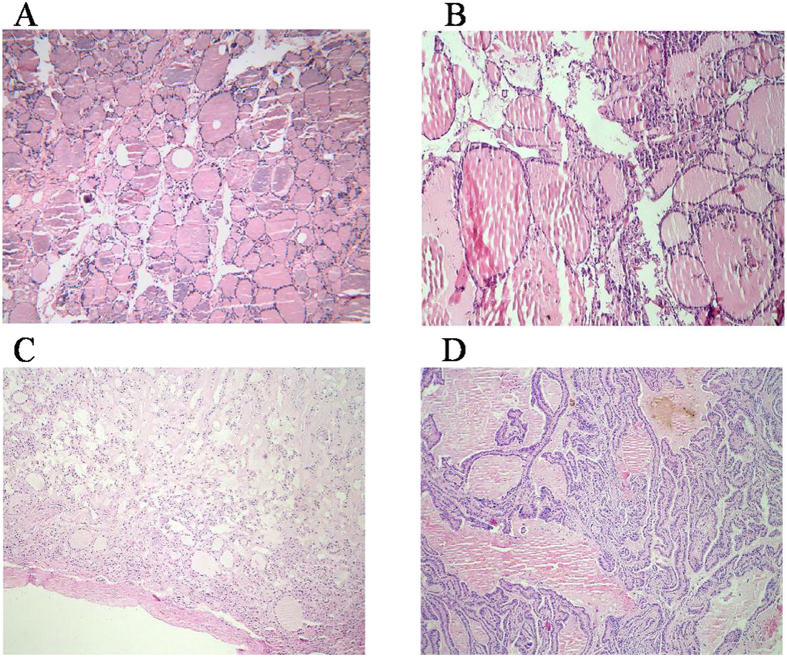
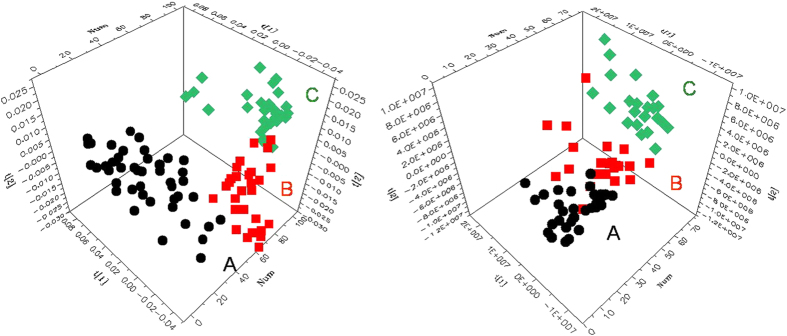
 ), (B) benign thyroid lesions (
 ), (C) malignant thyroid lesions (
 ). Benign groups: NG and FA. Malignant groups: PTC.
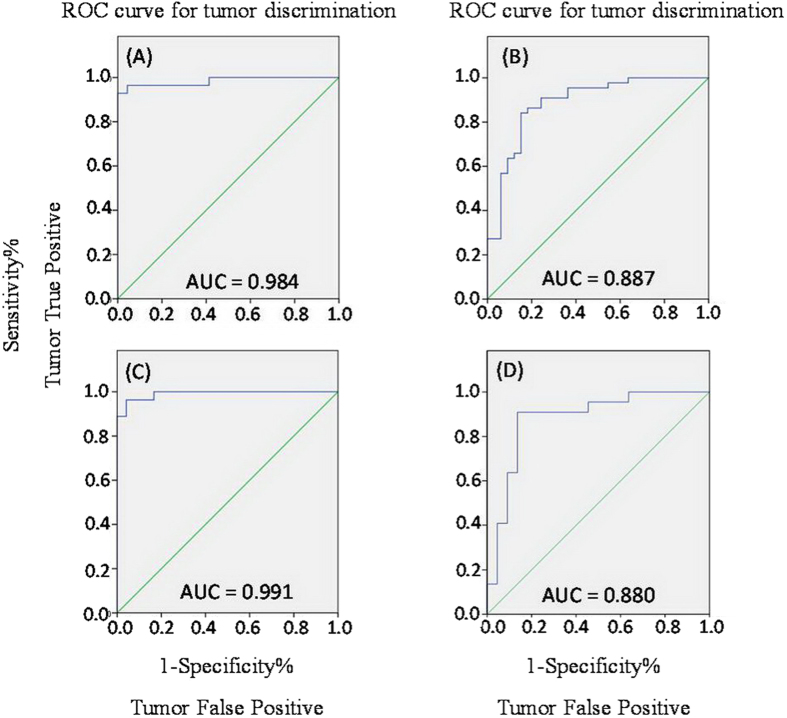
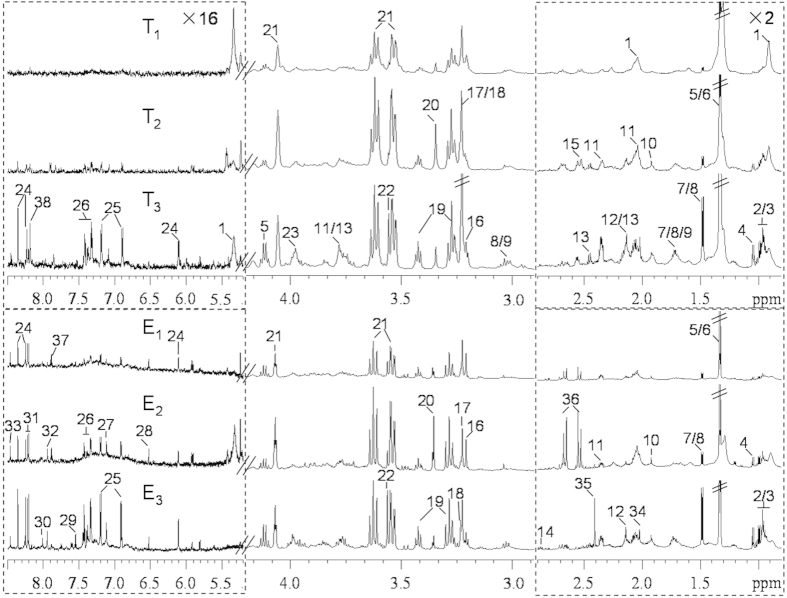
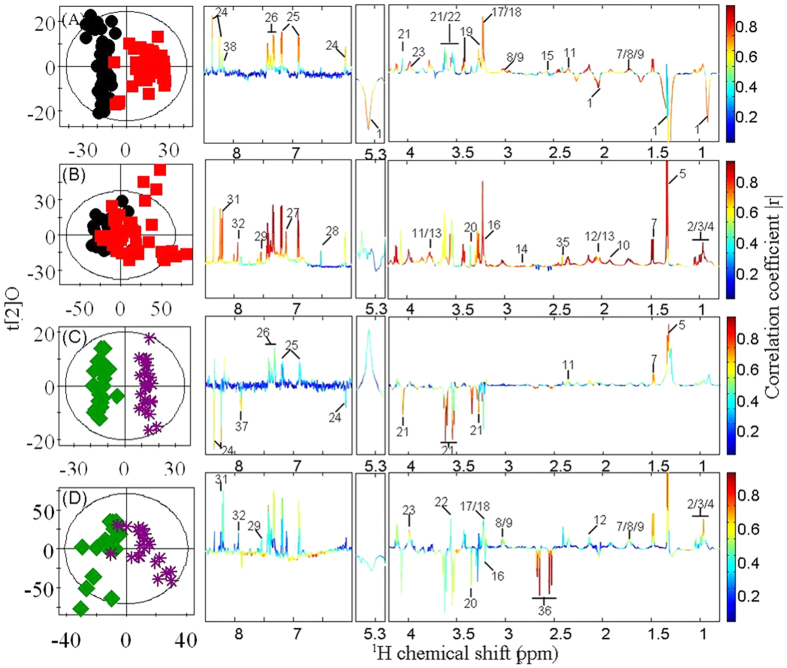 ), thyroid lesions (), benign thyroid lesions () and malignant thyroid lesions (
 ). Key to metabolite is given in Table 1.
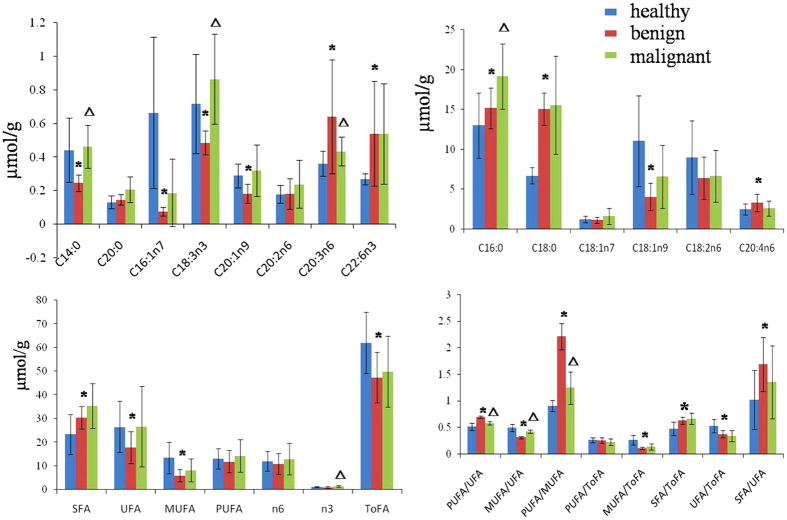
 ), (B) benign thyroid lesions (
 ) and (C) malignant thyroid lesions (
 ). *p < 0.05 when compared to healthy adjacent thyroid tissue, Δp < 0.05 when compared to benign thyroid tissue.
Similar articles
-
Immunohistochemical Subcellular Localization of Protein Biomarkers Distinguishes Benign from Malignant Thyroid Nodules: Potential for Fine-Needle Aspiration Biopsy Clinical Application.Thyroid. 2015 Nov;25(11):1224-34. doi: 10.1089/thy.2015.0114. Epub 2015 Aug 6. Thyroid. 2015. PMID: 26131603
-
Advances in metabolomics of thyroid cancer diagnosis and metabolic regulation.Endocrine. 2019 Jul;65(1):1-14. doi: 10.1007/s12020-019-01904-1. Epub 2019 Apr 1. Endocrine. 2019. PMID: 30937722 Review.
-
Immunohistochemical expression of HBME-1 and galectin-3 in the differential diagnosis of follicular-derived thyroid nodules.Pathol Res Pract. 2014 Dec;210(12):971-8. doi: 10.1016/j.prp.2014.06.010. Epub 2014 Jun 27. Pathol Res Pract. 2014. PMID: 25041837
-
Utility of contrast-enhanced ultrasound for evaluation of thyroid nodules.Thyroid. 2010 Jan;20(1):51-7. doi: 10.1089/thy.2009.0045. Thyroid. 2010. PMID: 20067379
-
Pediatric thyroid nodules: insights in management.Bol Asoc Med P R. 1998 Apr-Jun;90(4-6):74-8. Bol Asoc Med P R. 1998. PMID: 9866271 Review.
Cited by
-
Serum-based metabolic alterations in patients with papillary thyroid carcinoma unveiled by non-targeted 1H-NMR metabolomics approach.Iran J Basic Med Sci. 2018 Nov;21(11):1140-1147. doi: 10.22038/IJBMS.2018.30375.7323. Iran J Basic Med Sci. 2018. PMID: 30483387 Free PMC article.
-
Towards in vivo characterization of thyroid nodules suspicious for malignancy using multispectral optoacoustic tomography.Eur J Nucl Med Mol Imaging. 2023 Jul;50(9):2736-2750. doi: 10.1007/s00259-023-06189-1. Epub 2023 Apr 11. Eur J Nucl Med Mol Imaging. 2023. PMID: 37039901 Free PMC article.
-
NMR metabolic fingerprints of murine melanocyte and melanoma cell lines: application to biomarker discovery.Sci Rep. 2017 Feb 15;7:42324. doi: 10.1038/srep42324. Sci Rep. 2017. PMID: 28198377 Free PMC article.
-
Metabolomics Analysis in Serum from Patients with Colorectal Polyp and Colorectal Cancer by 1H-NMR Spectrometry.Dis Markers. 2019 Apr 7;2019:3491852. doi: 10.1155/2019/3491852. eCollection 2019. Dis Markers. 2019. PMID: 31089393 Free PMC article.
-
A glance at the actual role of glutamine metabolism in thyroid tumorigenesis.EXCLI J. 2021 Jul 12;20:1170-1183. doi: 10.17179/excli2021-3826. eCollection 2021. EXCLI J. 2021. PMID: 34345235 Free PMC article. Review.
References
-
- Lansford C. D. & Teknos T. N. Evaluation of the thyroid nodule. Cancer control 13, 89–98 (2006). - PubMed
-
- Ghassi D. & Donato A. Evaluation of the thyroid nodule. Postgrad. Med. J. 85, 190–195 (2009). - PubMed
-
- Siegel R. L., Miller K. D. & Jemal A. Cancer Statistics, 2015. Ca-Cancer. J. Clin. 65, 5–29 (2015). - PubMed
-
- Niedziela M. Thyroid nodules. Best. Pract. Res. Cl. En. 28, 245–277 (2014). - PubMed
-
- Alexander E. K. et al.. Preoperative diagnosis of benign thyroid nodules with indeterminate cytology. New Engl. J. Med. 367, 705–715 (2012). - PubMed
Publication types
MeSH terms
Substances
LinkOut - more resources
Full Text Sources
Other Literature Sources
Medical
Miscellaneous
