. 2015 Oct 20:15:209.
doi: 10.1186/s12883-015-0464-4.

A pilot cohort study of cerebral autoregulation and 2-year neurodevelopmental outcomes in neonates with hypoxic-ischemic encephalopathy who received therapeutic hypothermia

Affiliations

A pilot cohort study of cerebral autoregulation and 2-year neurodevelopmental outcomes in neonates with hypoxic-ischemic encephalopathy who received therapeutic hypothermia

Vera Joanna Burton et al. BMC Neurol. .

Abstract

Background: Neurodevelopmental disabilities persist in survivors of neonatal hypoxic-ischemic encephalopathy (HIE) despite treatment with therapeutic hypothermia. Cerebrovascular autoregulation, the mechanism that maintains cerebral perfusion during changes in blood pressure, may influence outcomes. Our objective was to describe the relationship between acute autoregulatory vasoreactivity during treatment and neurodevelopmental outcomes at 2 years of age.

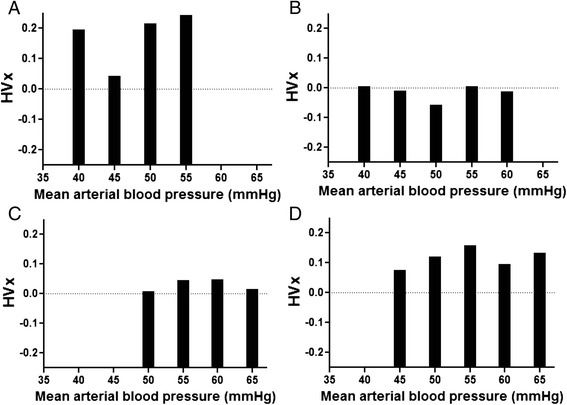
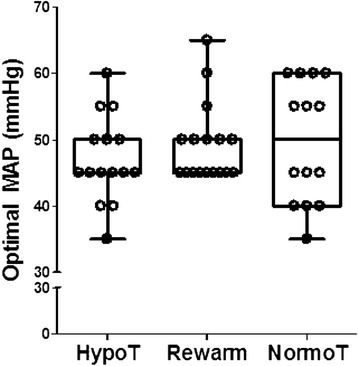
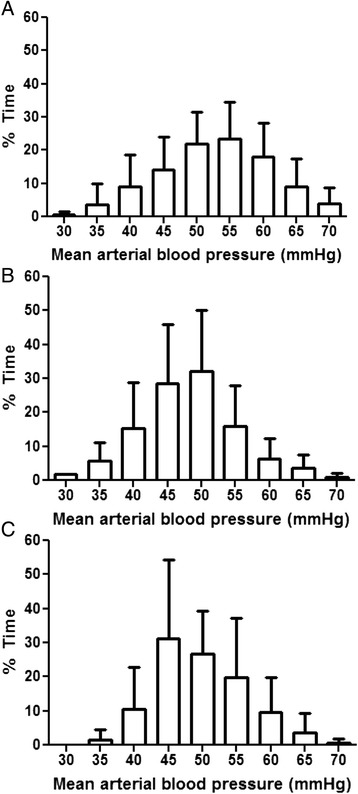
Methods: In a pilot study of 28 neonates with HIE, we measured cerebral autoregulatory vasoreactivity with the hemoglobin volume index (HVx) during therapeutic hypothermia, rewarming, and the first 6 h of normothermia. The HVx, which is derived from near-infrared spectroscopy, was used to identify the individual optimal mean arterial blood pressure (MAPOPT) at which autoregulatory vasoreactivity is greatest. Cognitive and motor neurodevelopmental evaluations were completed in 19 children at 21-32 months of age. MAPOPT, blood pressure in relation to MAPOPT, blood pressure below gestational age + 5 (ga + 5), and regional cerebral oximetry (rSO2) were compared to the neurodevelopmental outcomes.

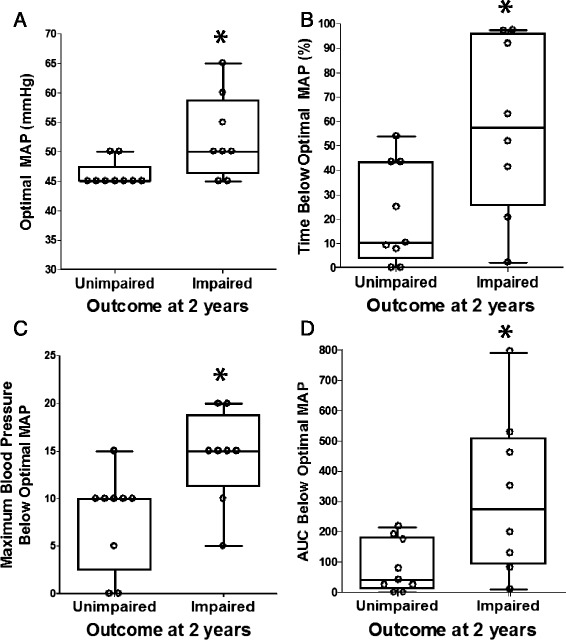
Results: Nineteen children who had HIE and were treated with therapeutic hypothermia performed in the average range on cognitive and motor evaluations at 21-32 months of age, although the mean performance was lower than that of published normative samples. Children with impairments at the 2-year evaluation had higher MAPOPT values, spent more time with blood pressure below MAPOPT, and had greater blood pressure deviation below MAPOPT during rewarming in the neonatal period than those without impairments. Greater blood pressure deviation above MAPOPT during rewarming was associated with less disability and higher cognitive scores. No association was observed between rSO2 or blood pressure below ga + 5 and neurodevelopmental outcomes.

Conclusion: In this pilot cohort, motor and cognitive impairments at 21-32 months of age were associated with greater blood pressure deviation below MAPOPT during rewarming following therapeutic hypothermia, but not with rSO2 or blood pressure below ga + 5. This suggests that identifying individual neonates' MAPOPT is superior to using hemodynamic goals based on gestational age or rSO2 in the acute management of neonatal HIE.


Figures

Fig. 1
Fig. 1
Representative hemoglobin volume index (HVx) bar graphs from individual neonates illustrate identification of the optimal mean arterial blood pressure (MAPOPT) at the nadir of HVx. MAPOPT values were 45 mmHg for patient 1 (a) and 50 mmHg for patient 2 (b). Patients 5 (c) and 25 (d) did not have a nadir in HVx and were therefore coded as having an unidentifiable MAPOPT
Fig. 2
Fig. 2
Optimal mean arterial blood pressure (MAP) values were similar during hypothermia (hypoT; n = 15), rewarming (rewarm; n = 17), and the first 6 h of normothermia (normoT; n = 14). p = 0.831 for hypothermia vs. rewarming; p = 0.313 for hypothermia vs. normothermia; p = 0.685 for rewarming vs. normothermia by Wilcoxon signed rank tests. Box plots with whiskers (5th–95th percentiles) are shown. Each circle represents one neonate
Fig. 3
Fig. 3
The percentages of time during hypothermia (n = 19; a), rewarming (n = 17; b), and normothermia (n = 16; c) that neonates spent at each level of mean arterial blood pressure. Data are shown as means with SDs
Fig. 4
Fig. 4
Optimal mean arterial blood pressure (MAP) and blood pressure below optimal MAP during the neonatal rewarming period in relation to neurodevelopmental outcome at approximately 2 years of age. In comparison to children without impairments (n = 9; unimpaired), children who developed impairments (n = 8; impaired) had higher optimal MAP values (*p = 0.023; a), spent a greater percentage of time with blood pressure below optimal MAP (*p = 0.048; b), had greater maximal blood pressure deviation below optimal MAP (*p = 0.019; c), and had greater area under the curve (AUC) below optimal MAP (*p = 0.039; d) during rewarming. Data were analyzed by Mann Whitney rank sum tests. Box plots with whiskers (5th–95th percentiles) are shown. Each circle represents one child
Fig. 5
Fig. 5
Blood pressure above the optimal mean arterial blood pressure (MAP) during the neonatal rewarming period in relation to neurodevelopmental outcome at approximately 2 years of age. When compared to children without impairments (n = 9; unimpaired), those who developed impairments (n = 8; impaired) spent a lower percentage of the rewarming period with blood pressure above optimal MAP (*p = 0.039; a) and had less maximal blood pressure deviation above optimal MAP (*p = 0.021; b) during rewarming. Data were analyzed by Mann Whitney rank sum tests. Box plots with whiskers (5th–95th percentiles) are shown. Each circle represents one child
Fig. 6
Fig. 6
Blood pressure in relation to the optimal mean arterial blood pressure (MAP) during the neonatal rewarming period and the Mullen score at approximately 2 years of age. Higher Mullen scores correlated with a greater percentage of the rewarming period spent with blood pressure above optimal MAP (n = 13; r = 0.560, p = 0.044; a) and greater maximal blood pressure deviation above optimal MAP (n = 13; r = 0.585; p = 0.035; b). Lower Mullen scores correlated with greater maximal blood pressure deviation below optimal MAP (n = 13; r = –0.563; p = 0.044; c). Data were analyzed by Spearman correlations. Each circle represents one child

References

    1. Volpe JJ. Perinatal brain injury: from pathogenesis to neuroprotection. Ment Retard Dev Disabil Res Rev. 2001;7(1):56–64. doi: 10.1002/1098-2779(200102)7:1<56::AID-MRDD1008>3.0.CO;2-A. - DOI - PubMed
    1. Graham EM, Ruis KA, Hartman AL, Northington FJ, Fox HE. A systematic review of the role of intrapartum hypoxia-ischemia in the causation of neonatal encephalopathy. Am J Obstet Gynecol. 2008;199(6):587–95. doi: 10.1016/j.ajog.2008.06.094. - DOI - PubMed
    1. Shankaran S, Pappas A, McDonald SA, Vohr BR, Hintz SR, Yolton K, et al. Childhood outcomes after hypothermia for neonatal encephalopathy. NEJM. 2012;366(33):2085–92. doi: 10.1056/NEJMoa1112066. - DOI - PMC - PubMed
    1. Martin JA, Hamilton BE, Sutton PD, Ventura SJ, Menacker F, Munson ML. Births: final data for 2003. Natl Vital Stat Rep. 2005;54(2):1–116. - PubMed
    1. US Department of Health and Human Services Centers for Disease Control and Prevention. Economic costs associated with mental retardation, cerebral palsy, hearing loss, and vision impairment – United States, 2003. MMWR Morb Mortality Wkly Rep. 2004;53(03):57–9. - PubMed

Publication types

MeSH terms