. 2016 Dec;48(4):1266-1284.
doi: 10.3758/s13428-015-0653-5.

Digital LED Pixels: Instructions for use and a characterization of their properties

Affiliations

Digital LED Pixels: Instructions for use and a characterization of their properties

Pete R Jones et al. Behav Res Methods. 2016 Dec.

Abstract

This article details how to control light emitting diodes (LEDs) using an ordinary desktop computer. By combining digitally addressable LEDs with an off-the-shelf microcontroller (Arduino), multiple LEDs can be controlled independently and with a high degree of temporal, chromatic, and luminance precision. The proposed solution is safe (can be powered by a 5-V battery), tested (has been used in published research), inexpensive (∼ $60 + $2 per LED), highly interoperable (can be controlled by any type of computer/operating system via a USB or Bluetooth connection), requires no prior knowledge of electrical engineering (components simply require plugging together), and uses widely available components for which established help forums already exist. Matlab code is provided, including a 'minimal working example' of use suitable for use by beginners. Properties of the recommended LEDs are also characterized, including their response time, luminance profile, and color gamut. Based on these, it is shown that the LEDs are highly stable in terms of both luminance and chromaticity, and do not suffer from issues of warm-up, chromatic shift, and slow response times associated with traditional CRT and LCD monitor technology.

Keywords: Arduino; Color gamut; Light emitting diode; Luminance; Timing.


Figures

Fig. 1
Fig. 1
Two example uses of LEDs in behavioral experiments. a Illuminated visual landmarks for a study of navigation (image adapted from Nardini et al. (2008)). Duplicate sets of landmarks (shown lower-right of panel a) were positioned at regular intervals around the room, and could be switched on/off, effectively rotating the landmarks with respect to the participant. The objects on the floor were illuminated using chemiluminescent paint. Now, though, these movable objected could be instead fitted with LEDs and wireless microcontrollers. b A 2.5-m-long arc of lights and speakers, for a study of audiovisual localization (used in Garcia et al. (2015)). On each presentation, a subset of the LEDs (outlined in purple) and/or speakers (outlined in blue) at a particular location were activated. The LED hardware used was identical to that described in the present paper, and allowed each of 100 LED lights to be controlled independently using commands sent from a central control computer (not shown)
Fig. 2
Fig. 2
Schematic illustration of the key hardware required. a A strip of digitally addressable LED ‘Pixels’. Each pixel consists of three independent LEDs (red, green, blue), located behind a diffuser, and controlled by an internal chip (WS2801). b A 5-V power supply (either battery or mains adapter). c An Arduino Uno microcontroller, used to control the LED Pixels. d An ordinary laptop or PC to program, control, and supply power to the Arduino. See body text for details, and Table 1 for further particulars
Fig. 3
Fig. 3
Flow chart showing how the Matlab (orange), Arduino (cyan), and LED (gray) systems interact. Example source code for main.m, callback.m, and amain.ino is provided in Listings 1–3, respectively. See body text for details
Listing 1
Listing 1
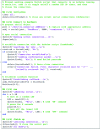
Matlab main program script (main.m), for interacting with LED Pixels via an Arduino microcontroller. See body text for details
Listing 2
Listing 2
Matlab callback code (callback.m), for receiving data returned over the serial connection from Arduino. See body text for details
Listing 3
Listing 3
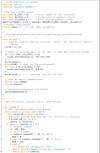
Arduino code (amain.iso), for receiving serial commands from Matlab, controlling LED Pixels accordingly, and returning status updates to Matlab
Listing 3
Listing 3
Arduino code (amain.iso), for receiving serial commands from Matlab, controlling LED Pixels accordingly, and returning status updates to Matlab
Fig. 4
Fig. 4
Gamma function: mean (± 1 S.E., across five LED Pixels) luminance output, as a function of command level input. Shown for a white light, and for each red, green, blue LED presented in isolation. Error bars not visible when standard error < marker size
Fig. 5
Fig. 5
a Half-luminance viewing angle (HLVA) for a full-intensity white light. The vertical dashed line indicates the largest angle at which measured luminance was 50 % of the maximum. Variability in luminance not accounted for by the least-square linear fit (r 2= 0.89) is likely due to human error in where the colorimeter was positioned relative to the center of the LED Pixel (i.e., error in the x-axis of the graph). See Supplemental Material (Fig. S1) for analogous recordings from a CRT and LCD monitor. b Analogous recordings for each of the three individual RGB elements
Fig. 6
Fig. 6
Drain a and halation b. Markers show mean (± 1 S.E.) luminance for a single LED Pixel (same throughout), as two flanker pixels are brought progressively closer to the target. See body text for details. See Supplemental Material (Fig. S2) for analogous measurements for each individual RGB element
Fig. 7
Fig. 7
Drain effects for increasing dense displays. Each point gives mean (± 1 S.E.) luminance for 12 measurements of the same, ‘target’ LED Pixel. Error bars were smaller than marker size in all cases and so are not visible. The target was the central LED Pixel in a strand of 123 LED Pixels. The flanker gap was fixed at ± 10 pixels, and the number of flankers was varied, with half either side of the target. The target and any flankers were set to maximum luminance (RGB =〈255,255,255〉)
Fig. 8
Fig. 8
a Relative power spectral density of a LED Pixel at maximum luminance (i.e., relative whitelight irradiance as a function of wavelength). b CIE (1936) color space chromaticity diagram, with triangles showing the gamut of the LED Pixels (thick black) and the sRGB industry display standard (thin blue)
Fig. 9
Fig. 9
Changes in LED Pixel chromaticity coordinates (± 1 S.E.) as a function of a input command level, b drain, c halation, d warm-up, and e viewing angle. The out-of-axes markers in (e) indicate additional measurements made at + 70 . The numeric values for (a) are given in the Supplemental Material (Table SI)
Fig. 10
Fig. 10
a, b Response time curves, averaged over 10,000 off-on (a) or on-off (b) transition. Individual measurements were aligned temporally via crosscorrelation prior to averaging. Panels c and d show the distribution of cross-correlation lag times (i.e., amount of trial-by-trial lateral variability in the response curve shown above). The shape of the curves in the upper panels indicates the response time. The distributions in the lower panels indicate mean onset lag (green vertical line), and variability in onset lag (histograms)
Fig. 11
Fig. 11
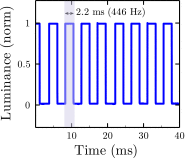
LED Pixel refresh rates. Curve shows relative luminance output (normalized by dividing by maximum observed level) as a function of time, as a single LED Pixel was turned on/off without any user-specified delay. Highlighting shows a single, example sustained duration, which lasted 2.2 ms
Fig. 12
Fig. 12
LED Pixel warm-up dynamics, showing luminance measurements for three grey levels (CL = 8, 128, 255), and for each of the three RGB color elements (CL = 255), as a function of time. Markers show mean (+ -SE) luminance levels for each of seven LED Pixels, measured independently (error bars not visible when smaller than marker). Lines represent least-square regression fits, and did not differ from zero in any case (no change in luminance with time; see body text for details)

Similar articles

Cited by

References

    1. Maxwell JC. Experiments on Colour, as perceived by the Eye, with Remarks on Colour-Blindness. Transactions of the Royal Society Edinburgh. 1857;21:275–298. doi: 10.1017/S0080456800032117. - DOI
    1. Mach, E. (1959). The analysis of sensations (Translated by CM Williams & S. Waterlow, original work published, 1886).
    1. Fry GA. Mechanisms subserving simultaneous brightness contrast. Am. J. Optom. Arch. Am. Acad. Optom. 1948;25:162–178. doi: 10.1097/00006324-194804000-00002. - DOI - PubMed
    1. Tschermak-Seysenegg A. Über parallaktoskopie. Pflüger’s Arch. für die gesamte Physiol. des Menschen und der Tiere. 1939;241:455–469. doi: 10.1007/BF01755547. - DOI
    1. Howard, I.P. (2012). Perceiving in depth, volume 1: basic mechanisms: Oxford University Press.

LinkOut - more resources