. 2016 Jan 15;25(2):114-22.
doi: 10.1089/scd.2015.0193. Epub 2015 Dec 10.

Energy Metabolism in Mesenchymal Stem Cells During Osteogenic Differentiation

Affiliations

Energy Metabolism in Mesenchymal Stem Cells During Osteogenic Differentiation

Laura C Shum et al. Stem Cells Dev. .

Abstract

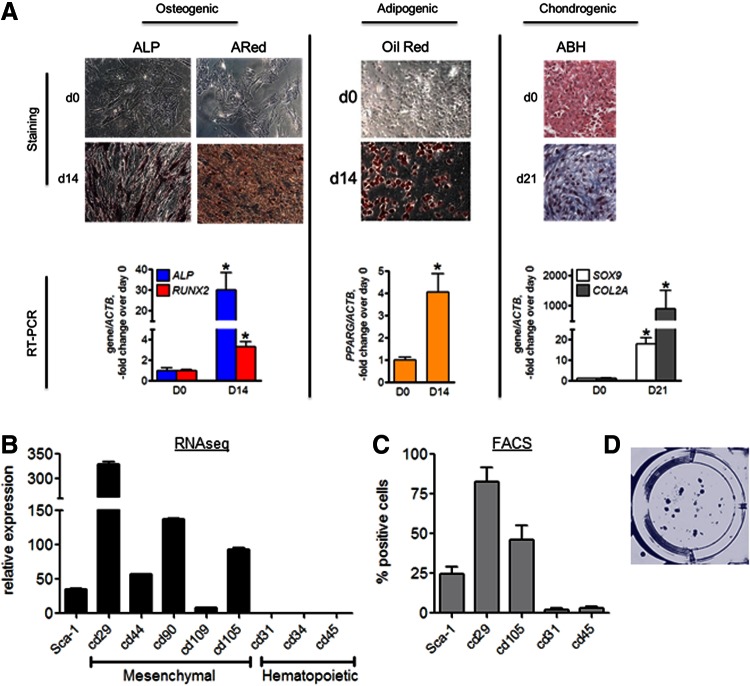
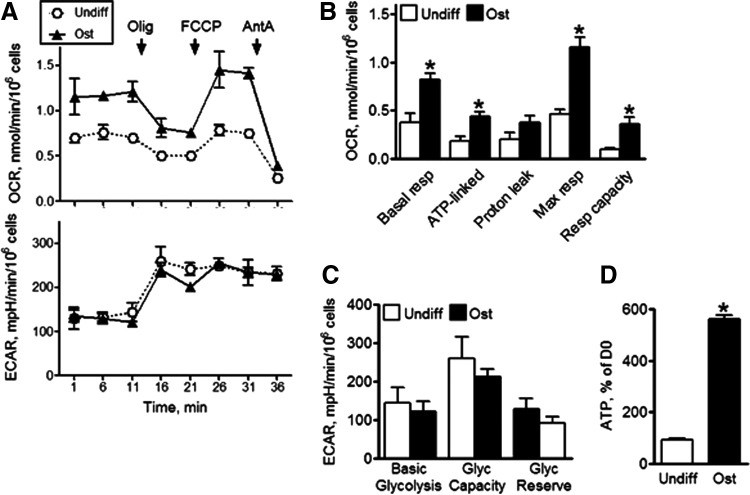
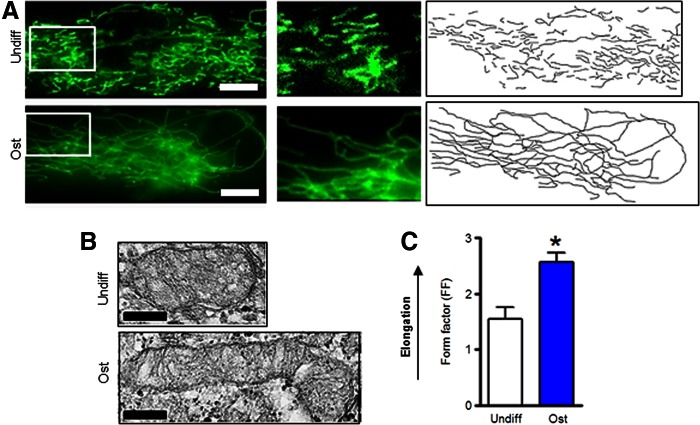
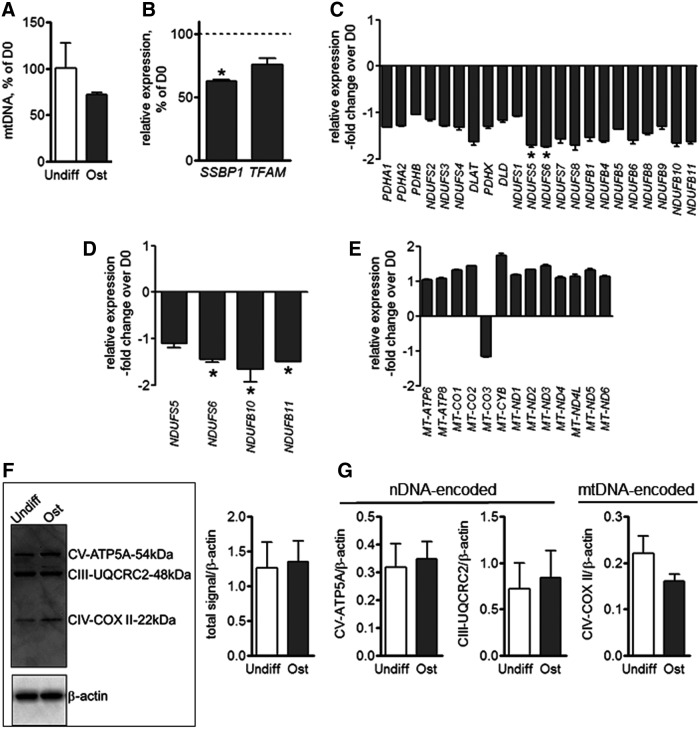
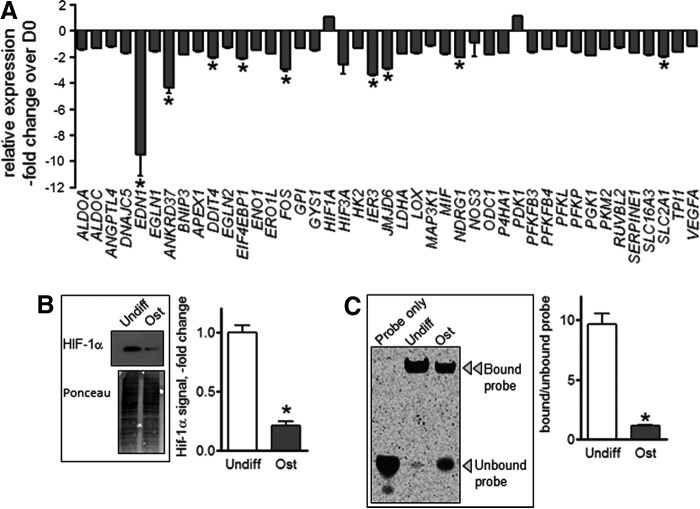
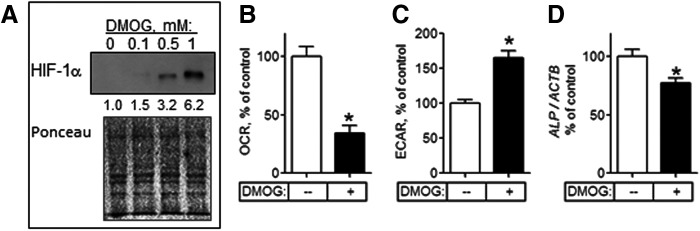
There is emerging interest in stem cell energy metabolism and its effect on differentiation. Bioenergetic changes in differentiating bone marrow mesenchymal stem cells (MSCs) are poorly understood and were the focus of our study. Using bioenergetic profiling and transcriptomics, we have established that MSCs activate the mitochondrial process of oxidative phosphorylation (OxPhos) during osteogenic differentiation, but they maintain levels of glycolysis similar to undifferentiated cells. Consistent with their glycolytic phenotype, undifferentiated MSCs have high levels of hypoxia-inducible factor 1 (HIF-1). Osteogenically induced MSCs downregulate HIF-1 and this downregulation is required for activation of OxPhos. In summary, our work provides important insights on MSC bioenergetics and proposes a HIF-based mechanism of regulation of mitochondrial OxPhos in MSCs.


Figures

<b>FIG. 1.</b>
FIG. 1.
Characterization of MSCs. (A) Left: Undifferentiated (D0) and osteogenically induced cells (D14) were stained with ALP-specific stain and Alizarin Red (ARed). Real-time RT-PCR analysis of ALP and RUNX2 expression normalized to ACTB. Middle: Undifferentiated (D0) and adipogenically induced cells (D14) were stained with Oil Red O. Real-time RT-PCR analysis of PPARG expression normalized to ACTB. Right: Undifferentiated (D0) and chondrogenically induced cells (D21) were stained with ABH. Real-time RT-PCR analysis of SOX9 and COL2A expression normalized to ACTB. Cell staining panels are representatives of four. Data in graphs are mean ± SEM (n = 4). *P < 0.05 as determined with t-test. (B) RNAseq analysis of surface markers expression in undifferentiated MSCs. Data are mean ± SEM (n = 3). (C) Flow cytometry analysis of surface markers in undifferentiated MSCs. Data are mean ± SEM (n = 5). (D) Clonogenic capacity assay. Cells were plated at clonogenic density of 1.6/cm2 and stained with Crystal Violet at D21 (n = 6). ABH, alcian blue/hematoxylin; ALP, alkaline phosphatase; D0, day 0; D14, day 14; D21, day 21; MSC, mesenchymal stem (stromal) cells; RNAseq, RNA sequencing; RT-PCR, real time reverse transcriptase polymerase chain reaction. Color images available online at www.liebertpub.com/scd
<b>FIG. 2.</b>
FIG. 2.
Bioenergetic profiling of MSCs during differentiation. (A) OCR and ECAR were analyzed using Seahorse XF24. OCR was measured at baseline and after addition of Olig, FCCP, and AntA. (B) Mitochondrial respiratory indexes were calculated as described in the Materials and Methods section. (C) Glycolytic indexes were calculated as described in the Materials and Methods section. (D) ATP was measured in cell lysates with bioluminescence assay and expressed as % of values at D0. Data are mean ± SEM (n = 4). *P < 0.05 as determined with t-test. AntA, antimycin A; ECAR, extracellular acidification rate; OCR, oxygen consumption rate; Olig, oligomycin; Ost, osteogenically differentiated MSCs; Undiff, undifferentiated MSCs.
<b>FIG. 3.</b>
FIG. 3.
Mitochondrial morphology in MSCs during differentiation. (A) Cells were stained with MitoTracker Green (MTG) and live-cell fluorescent images were taken. The middle panels are magnified regions of cells shown in the left panels. The right panels show tracing of the MTG signal shown in the left panels. Images are representatives of 30 cells from three different plates. (B) Electron micrographs of MSCs. Images are representatives of 30 cells/group from three different plates. Scale bar is 200 nm. (C) Mitochondrial form factor (FF), a measure of mitochondrial elongation, was calculated using electron microscopy. Data are mean ± SEM (n = 30). *P < 0.05 as determined with t-test. Color images available online at www.liebertpub.com/scd
<b>FIG. 4.</b>
FIG. 4.
Mitochondrial biogenesis in MSCs during differentiation. (A) mtDNA was assayed using qPCR and expressed as % of D0 values. (B) Gene expression of mitochondrial biogenesis factors SSBP1 and TFAM in ost-MSCs relative to undifferentiated MSCs as analyzed with RNAseq. (C) Gene expression of OxPhos structural and regulatory factors in ost-MSCs relative to undiff-MSC as analyzed with RNAseq. (D) Gene expression of OxPhos factors in ost-MSCs relative to undiff-MSC as analyzed with qPCR. (E) Gene expression of mitochondrial RNA as analyzed with RNAseq. (F) Protein analysis of OxPhos factors by western blot. (G) Densitometry analysis of (F). Data are mean ± SEM (n = 3). *P < 0.05 as determined with t-test. mtDNA, mitochondrial DNA; nDNA, nuclear DNA; OxPhos, oxidative phosphorylation; ost-MSCs, osteogenically induced MSCs; qPCR, quantitative polymerase chain reaction.
<b>FIG. 5.</b>
FIG. 5.
HIF-1 signaling changes during osteogenic differentiation of MSCs. (A) Expression of HIF signature genes in ost-MSC relative to undiff-MSCs as analyzed with RNAseq (n = 3/each). (B) Western blot of HIF-1α in undifferentiated and ost-MSCs. Ponceau S staining was used to verify equal loading. Densitometry values shown as fold change from undifferentiated MSCs. Blots are representatives of three. (C) Electrophoretic mobility shift assay of HIF-1α. DNA-binding activity using fluorescent probes and ratio of bound to unbound probe signal. Gel is representative of three. Data are mean ± SEM (n = 3). *P < 0.05 as determined with t-test. HIF, hypoxia-inducible factor.
<b>FIG. 6.</b>
FIG. 6.
Reactivation of HIF-1 signaling inhibits OxPhos activity in ost-MSCs. (A) Western blot of HIF-1α in ost-MSCs treated with indicated doses of DMOG for 48 h. Ponceau S staining was used to verify equal loading. Numbers under the HIF-1α blot show densitometry values for each band normalized to total protein. Blot is representative of three. OCR (B) and ECAR (C) in ost-MSCs treated with DMOG at 0.5 mM or PBS for 48 h. (D) Real-time RT-PCR analysis of expression of ALP normalized to ACTB in DMOG-treated ost-MSCs. Data in are mean ± SEM (n = 3 to 5). *P < 0.05 as determined with t-test. DMOG, dimethyloxalylglycine.

References

    1. Bianco P, Cao X, Frenette PS, Mao JJ, Robey PG, Simmons PJ. and Wang C-Y. (2013). The meaning, the sense and the significance: translating the science of mesenchymal stem cells into medicine. Nat Med 19:35–42 - PMC - PubMed
    1. Manolagas SC. (2000). Birth and death of bone cells: basic regulatory mechanisms and implications for the pathogenesis and treatment of osteoporosis. Endocr Rev 21:115–137 - PubMed
    1. Saito M. and Marumo K. (2013). Bone quality in diabetes. Front Endocrinol 4:72 - PMC - PubMed
    1. Baker N, Boyette LB. and Tuan RS. (2015). Characterization of bone marrow-derived mesenchymal stem cells in aging. Bone 70:37–47 - PubMed
    1. Varum S, Rodrigues AS, Moura MB, Momcilovic O, Easley CA, Ramalho-Santos J, Van Houten B. and Schatten G. (2011). Energy metabolism in human pluripotent stem cells and their differentiated counterparts. PLoS One 6:e20914. - PMC - PubMed

Publication types

MeSH terms

Substances

LinkOut - more resources