. 2015 Oct 21:5:15458.
doi: 10.1038/srep15458.

Disparate developmental patterns of immune responses to bacterial and viral infections in fish

Affiliations

Disparate developmental patterns of immune responses to bacterial and viral infections in fish

Rosario Castro et al. Sci Rep. .

Erratum in

Abstract

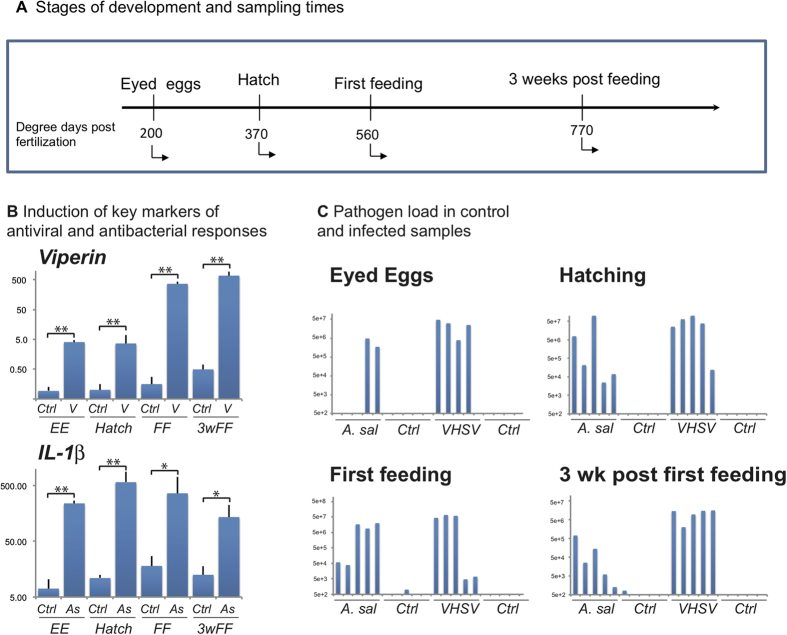
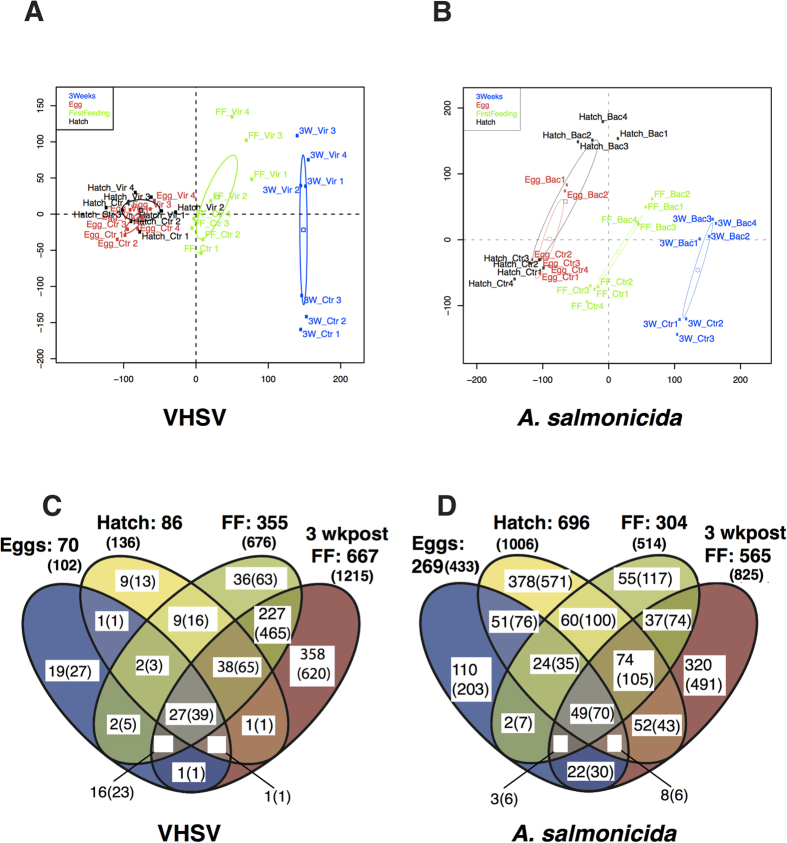
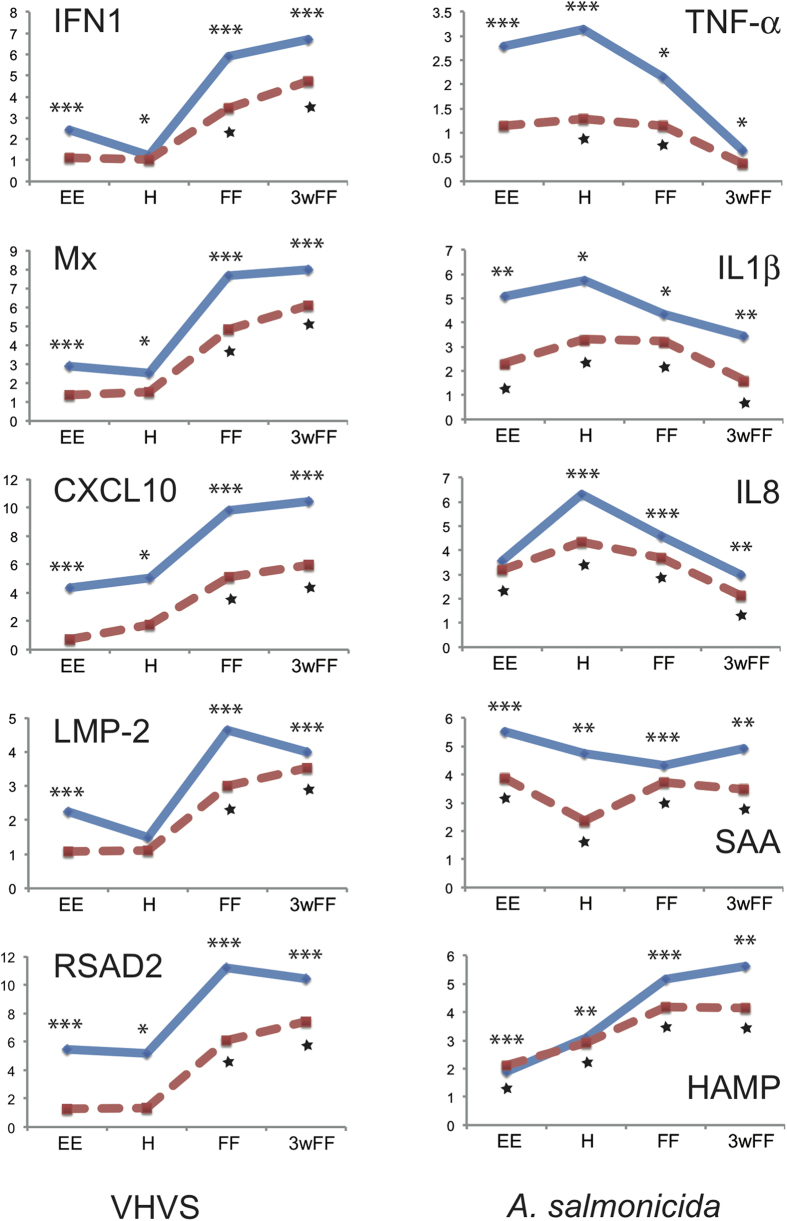
During early stages of development vertebrates rely on an immature immune system to fight pathogens, but in non mammalian species few studies have taken an in-depth analysis of the transition from reliance on innate immune mechanisms to the appearance of adaptive immunity. Using rainbow trout as a model we characterized responses to two natural pathogens of this species, the Gram negative bacterium Aeromonas salmonicida and the virus VHSV, using microarray analysis at four early life history stages; eyed egg, post hatch, first feeding and three weeks post first feeding when adaptive immunity starts to be effective. All stages responded to both infections, but the complexity of the response increased with developmental stage. The response to virus showed a clear interferon response only from first feeding. In contrast, bacterial infection induced a marked response from early stages, with modulation of inflammatory, antimicrobial peptide and complement genes across all developmental stages. Whilst the viral and bacterial responses were distinct, there were modulated genes in common, mainly of general inflammatory molecules. This work provides a first platform to explore the development of fish immunity to infection, and to compare the age-dependent changes (from embryo to adults) across vertebrates.


Figures

Figure 1
Figure 1. Design of the fish infection and transcriptome experiments.
(A) Stages of development and sampling times. (B) Induction of viperin and IL-1β after viral and bacterial injection, respectively (mean ±SE; N = 4), at selected stages of development. Significant differences were determined using unpaired t test (*P < 0.05; **P < 0.001). (C) Pathogen load in control and infected individuals assessed by VHSV or A. salmonicida specific real time PCR assay. The efficiency of each qPCR assay was determined using LinRegPCR. Results are represented in arbitrary units.
Figure 2
Figure 2. Global analysis of microarray data.
(A) Principal component analysis of all features (except features deposited on the array for internal control) at four stages of development: eyed eggs “egg” in red; hatching “hatch” in black; first feeding “FF” in green and 3 weeks post first feeding “3w” in blue. Samples (pools of eggs or fry) are noted as either “vir” when infected by VHSV or “ctrl” for controls. Projection on the two first axis is shown (dimension 1: horizontal axis; dimension 2: vertical axis). (B) Similar principal component analysis of modulated features from samples infected by A. salmonicida, noted as “bac” or controls “ctrl”. (C,D) Venn diagrams showing the number of genes significantly up- or down- regulated at each stage of development (p < 0.01; Fold Change (FC) > 2 or <0.5) by VHSV or A. salmonicida. The corresponding numbers of array features are given in brackets.
Figure 3
Figure 3. Comparison between transcriptomics responses of selected genes measured by micro-array (red dotted line) and by real time PCR (blue solid line).
Data are represented as Log2ratios of expression levels (infected/control). The complete qPCR dataset is in Table S3. Significant difference between infected and control fish are denoted by * for qPCR (*p < 5%; **p < 1%; ***p < 0.1%) and by ⋆  for micro arrays. For all ANOVA tests on qPCR results, the assumptions of normality and homoscedasticity were evaluated on model residuals using the Anderson-Darling and Levene’s tests, respectively. When data did not conform to these expectations, transformations were tested, including the Box-Cox and double square root. Data that deviated strongly from normality and homoscedasticity, even after trialling multiple transformations, were analysed using a nonparametric Kruskal-Wallis test. The qPCR data analysis is detailed in Supplementary method.
Figure 4
Figure 4. Functional analysis of the transcriptome response to VHSV.
(A) Enrichment of selected GO terms (BP, GO fat, from DAVID at http://david.abcc.ncifcrf.gov/) at different stages: eyed eggs “EE”; hatching “H”; first feeding “FF” and 3 weeks post first feeding “3wpFF”. Relative significance is depicted as a heatmap of p values (Benjamini correction). “ns” is for non significant enrichment at a given stage. (B) Analysis of gene expression responses in the TLR pathway upon VHSV infection. Virus modulated genes (adj. p < 0.01; FC > 2 or <0.5) at the four studied developmental stages were mapped on a simplified TLR pathway based on knowledge from mammals. White denotes genes that were not represented on the array platform. Analysis of gene expression in the RLR pathway is represented on figure S1.

References

    1. Yamagami K., Hamazaki T., Yasumasu S., Masuda K. & Iuchi I. Molecular and cellular basis of formation, hardening, and breakdown of the egg envelope in fish. Int. Rev. Cytol. 136, 51–92 (1992). - PubMed
    1. Scapigliati G., Meloni S. & Mazzini M. A monoclonal antibody against chorion proteins of the sea bass Dicentrarchus labrax (Linnaeus, 1758): studies of chorion precursors and applicability in immunoassays. Biol. Reprod. 60, 783–789 (1999 ). - PubMed
    1. Magnadottir B., Lange S., Gudmundsdottir S., Bøgwald J. & Dalmo R. Ontogeny of humoral immune parameters in fish. Fish Shellfish Immunol. 19, 429–439 (2005). - PubMed
    1. Lovoll M. et al. The ontogeny and extrahepjatic expression of complement factor C3 in Atlantic salmon (Salmo salar). Fish & shellfish immunology 23, 542–552, doi: 10.1016/j.fsi.2007.01.002 (2007). - DOI - PubMed
    1. Lovoll M. et al. Maternal transfer of complement components C3-1, C3-3, C3-4, C4, C5, C7, Bf, and Df to offspring in rainbow trout (Oncorhynchus mykiss). Immunogenetics 58, 168–179, doi: 10.1007/s00251-006-0096-3 (2006). - DOI - PubMed

Publication types

MeSH terms

LinkOut - more resources