. 2016 Jan;228(1):49-59.
doi: 10.1530/JOE-15-0288. Epub 2015 Oct 20.

Prediabetes linked to excess glucagon in transgenic mice with pancreatic active AKT1

Affiliations

Prediabetes linked to excess glucagon in transgenic mice with pancreatic active AKT1

Toya M Albury-Warren et al. J Endocrinol. 2016 Jan.

Abstract

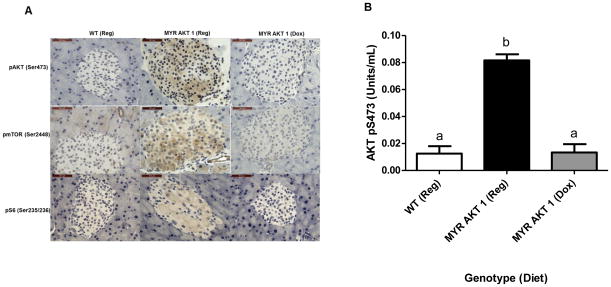
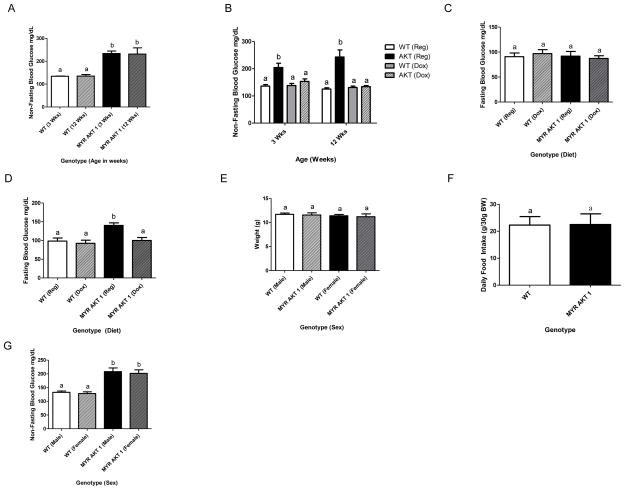
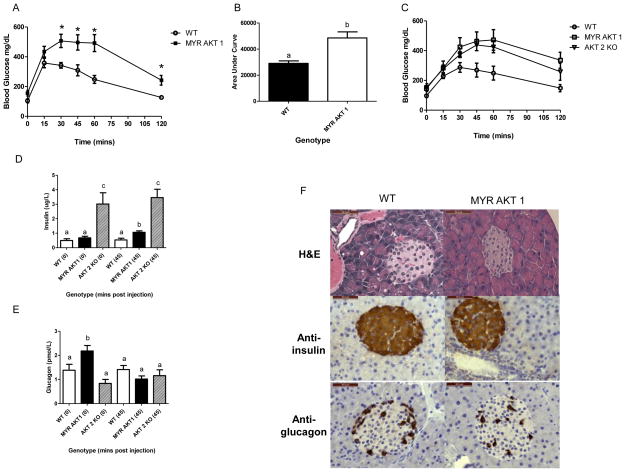
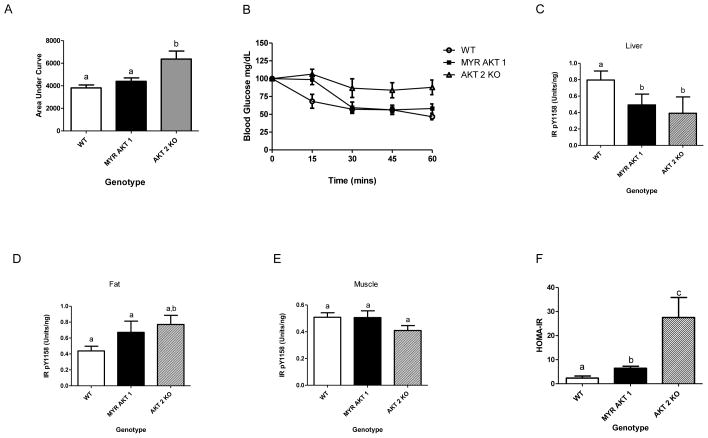
Protein kinase B/AKT has three isoforms (AKT1-3) and is renowned for its central role in the regulation of cell growth and proliferation, due to its constitutive activation in various cancers. AKT2, which is highly expressed in insulin-responsive tissues, has been identified as a primary regulator of glucose metabolism as Akt2 knockout mice (Akt2(-/-)) are glucose-intolerant and insulin-resistant. However, the role of AKT1 in glucose metabolism is not as clearly defined. We previously showed that mice with myristoylated Akt1 (AKT1(Myr)) expressed through a bicistronic Pdx1-TetA and TetO-MyrAkt1 system were susceptible to islet cell carcinomas, and in this study we characterized an early onset, prediabetic phenotype. Beginning at weaning (3 weeks of age), the glucose-intolerant AKT1(Myr) mice exhibited non-fasted hyperglycemia, which progressed to fasted hyperglycemia by 5 months of age. The glucose intolerance was attributed to a fasted hyperglucagonemia, and hepatic insulin resistance detectable by reduced phosphorylation of the insulin receptor following insulin injection into the inferior vena cava. In contrast, treatment with doxycycline diet to turn off the transgene caused attenuation of the non-fasted and fasted hyperglycemia, thus affirming AKT1 hyperactivation as the trigger. Collectively, this model highlights a novel glucagon-mediated mechanism by which AKT1 hyperactivation affects glucose homeostasis and provides an avenue to better delineate the molecular mechanisms responsible for diabetes mellitus and the potential association with pancreatic cancer.

Keywords: glucagon; glucose metabolism; insulin signaling; oncogenes; pancreas.


Conflict of interest statement

Declaration of Interests

There are no conflicts of interest biasing the research reported.

Figures

Figure 1
Figure 1. AKT1Myr mice have doxycycline-regulatable AKT/mTOR pathway activation in the pancreas
Hyperactivation and decreased activation of the AKT/mTOR pathway in AKT1Myr mice on regular chow diet and AKT1Myr mice on doxycycline diet, respectively, confirmed with: (A) immunostaining of representative pancreatic tissue using phospho-AKT (Ser 473), phospho-mTOR (Ser 2448), and phospho-S6 (Ser 235/236) antibodies (40X objective; Scale bar-50μm); and (B) analysis of protein from pancreatic tissue using a phospho-AKT1 (Ser 473) ELISA. Two-way ANOVA followed by student’s t-tests within groups were used to analyze the data. Data represented as mean ± SEM (n=5). All phospho-AKT1 measurements were normalized to their total AKT measurements. Abbreviations: WT – wild type mice; Reg-regular chow diet; Dox - doxycycline diet. Letters were used to illustrate significance as multiple groups are being compared (see materials and methods for explanation).
Figure 2
Figure 2. AKT1Myr mice have a reversible, fasted and non-fasted hyperglycemia
Blood glucose levels were measured with a glucometer (A) at weaning (p<0.0001) and at 12 weeks (p=0.0031). Weaning occurred at 3 weeks of age. To determine if the hyperglycemia exhibited at weaning was reversible, breeder mice were placed on a doxycycline diet to expose the pups in utero. Blood glucose levels were then measured (B) at weaning (p<0.02) and at 12 weeks (p≤0.003). Mice were fasted overnight (16 hours) to determine fasted blood glucose levels (C) at 12 weeks and (D) at 20 weeks (p<0.005). (E) Weight was measured at weaning. At 12 weeks, mice were housed individually and (F) food intake was measured daily for four days by weighing the food in the cage. Blood glucose levels, measured at weaning, were used to identify (G) sex differences. Two-way ANOVA followed by student’s t-tests within groups were used to analyze the data for figures 2A–E and 2G. Unpaired student’s t-test was used for figure 2F. N=10 for figures A–G except D (n=5). Abbreviations: Wks - week. Letters were used to illustrate significance as multiple groups are being compared (see materials and methods for explanation).
Figure 3
Figure 3. Glucose intolerance in AKT1Myr mice due to insulin-glucagon imbalance
Glucose tolerance testing (n=5) was performed at 12 weeks comparing: (A) wild type (WT) and AKT1Myr (MYR AKT1) mice and (C) WT, MYR AKT1, and Akt2−/− (AKT2 KO) mice (* indicates p<0.05). (B) Area under the curve. Data represented as mean ± SEM (p=0.0049). Blood was collected, via cheek bleeds, at the 0- and 45-minute timepoints to analyze serum (D) insulin and (E) glucagon levels using ELISAs. Insulin and glucagon values are also provided in Table 1. (F) Immunostaining of pancreatic tissue using insulin and glucagon antibodies (Objective 40X; Scale bar-50μm). Unpaired student’s t-tests were used to analyze differences in area under the curve and the glucose tolerance test time points. Two-way ANOVA followed by student’s t-tests within groups were used to analyze the data for figures 3D–E. Letters were used to illustrate significance as multiple groups are being compared (see materials and methods for explanation).
Figure 4
Figure 4. Insulin resistance in the liver of AKT1Myr mice
One week following the GTT, (B) an insulin tolerance test was performed (n=5). (A) Area under the curve. Data represented as mean ± SEM (p<0.04). To analyze insulin signaling, mice were insulin stimulated. Two minutes after injection the mice were euthanized and the pancreas, (C) liver, (D) adipose tissue, and (E) skeletal muscle were collected, protein extracted, and analyzed with insulin receptor (IR) Total and IR (pY1158) ELISAs. All phospho-IR measurements were normalized to their total IR measurements. (F) Homeostatic model assessment for insulin resistance (HOMA-IR) was calculated using the following measurements from the GTT: (fasted glucose x fasted insulin)/405. Data represented as mean ± SEM. Unpaired student’s t-tests were used to analyze differences in the insulin tolerance tests time points. One-way ANOVA followed by student’s t-tests within groups were used to analyze the data for figures 4A and 4C–F. Letters were used to illustrate significance as multiple groups are being compared (see materials and methods for explanation).
Figure 5
Figure 5. Decreased pancreas and islet size, with aging, in AKT1Myr mice
Pancreas size was measured upon euthanization and dissection using a digital scale (n=5) in (A) 12 week and (B) 16 month (p=0.0049) old mice. Islet size (n=50 islets) was also measured at (C) 12 weeks and (D) 16 months (p=0.008). Islet diameter was determined analyzing H&E stained sections through Axio Imaging Software. Unpaired student’s t-tests were used to analyze figures 5A–D. Data represented as mean ± SEM. Letters were used to illustrate significance as multiple groups are being compared (see materials and methods for explanation).

Similar articles

Cited by

References

    1. Albury TM, Pandey V, Gitto SB, Dominguez L, Spinel LP, Talarchek J, Klein-Szanto AJ, Testa JR, Altomare DA. Constitutive activation of Akt1 cooperates with KRasG12D to accelerate in vivo pancreatic tumor onset and progression. Neoplasia. 2015;17:175–183. - PMC - PubMed
    1. Altomare DA, Testa JR. Perturbations of the AKT signaling pathway in human cancer. Oncogene. 2005;24:7455–7464. - PubMed
    1. Baron AD, Schaeffer L, Shragg P, Kolterman OG. Role of hyperglucagonemia in maintenance of increased rates of hepatic glucose output in type II diabetics. Diabetes. 1987;36:274–283. - PubMed
    1. Basu A, Basu R, Shah P, Vella A, Johnson CM, Nair KS, Jensen MD, Schwenk WF, Rizza RA. Effects of type 2 diabetes on the ability of insulin and glucose to regulate splanchnic and muscle glucose metabolism: evidence for a defect in hepatic glucokinase activity. Diabetes. 2000;49:272–283. - PubMed
    1. Basu R, Basu A, Johnson CM, Schwenk WF, Rizza RA. Insulin dose-response curves for stimulation of splanchnic glucose uptake and suppression of endogenous glucose production differ in nondiabetic humans and are abnormal in people with type 2 diabetes. Diabetes. 2004;53:2042–2050. - PubMed

Publication types

MeSH terms