. 2015 Nov 10;112(45):E6158-65.
doi: 10.1073/pnas.1519079112. Epub 2015 Oct 20.

Agonist antibody that induces human malignant cells to kill one another

Affiliations

Agonist antibody that induces human malignant cells to kill one another

Kyungmoo Yea et al. Proc Natl Acad Sci U S A. .

Abstract

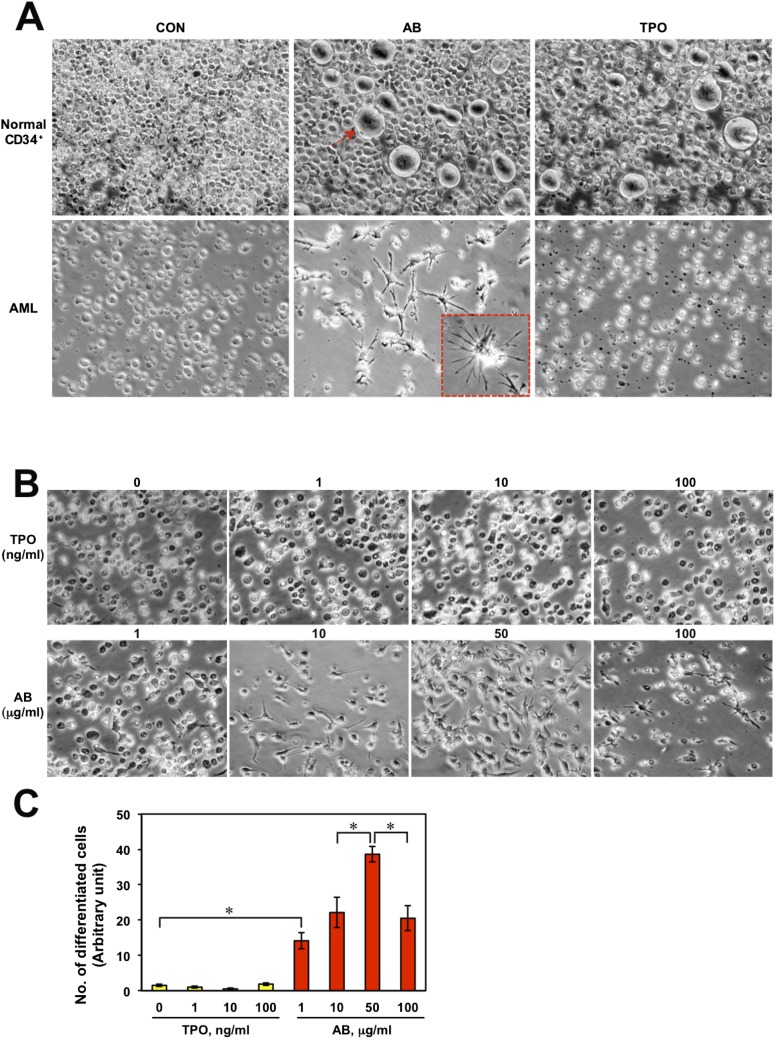
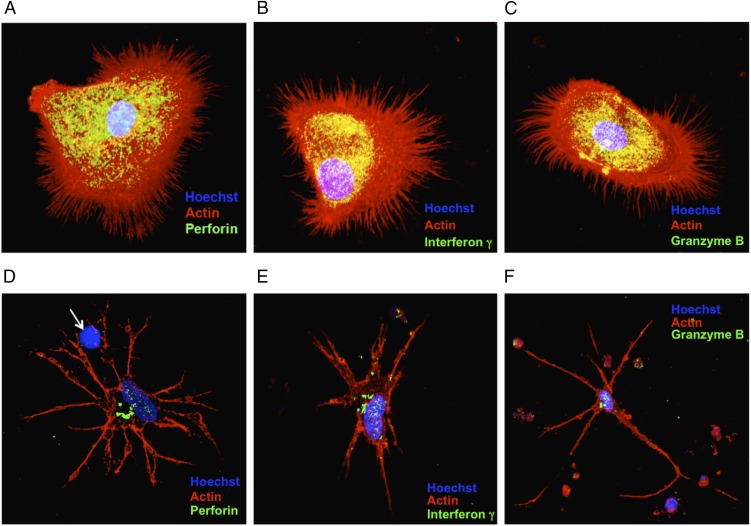
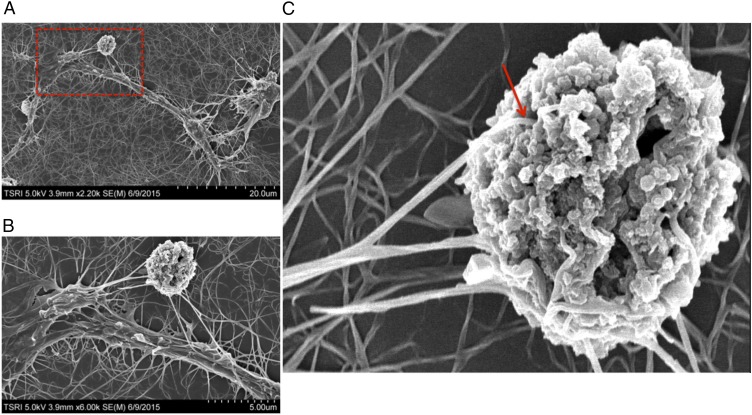
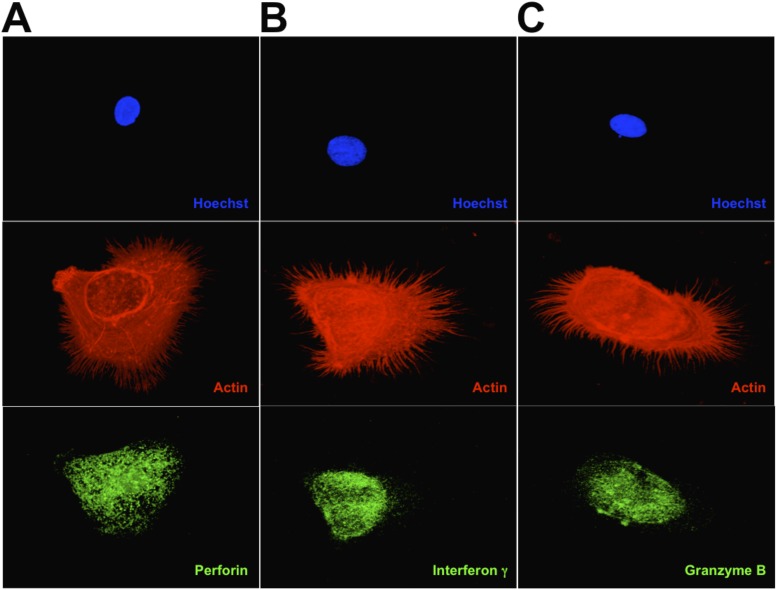
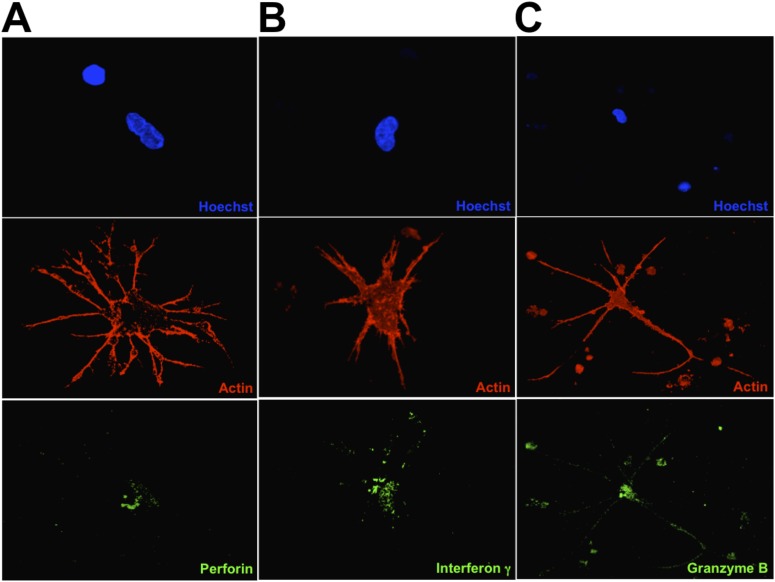
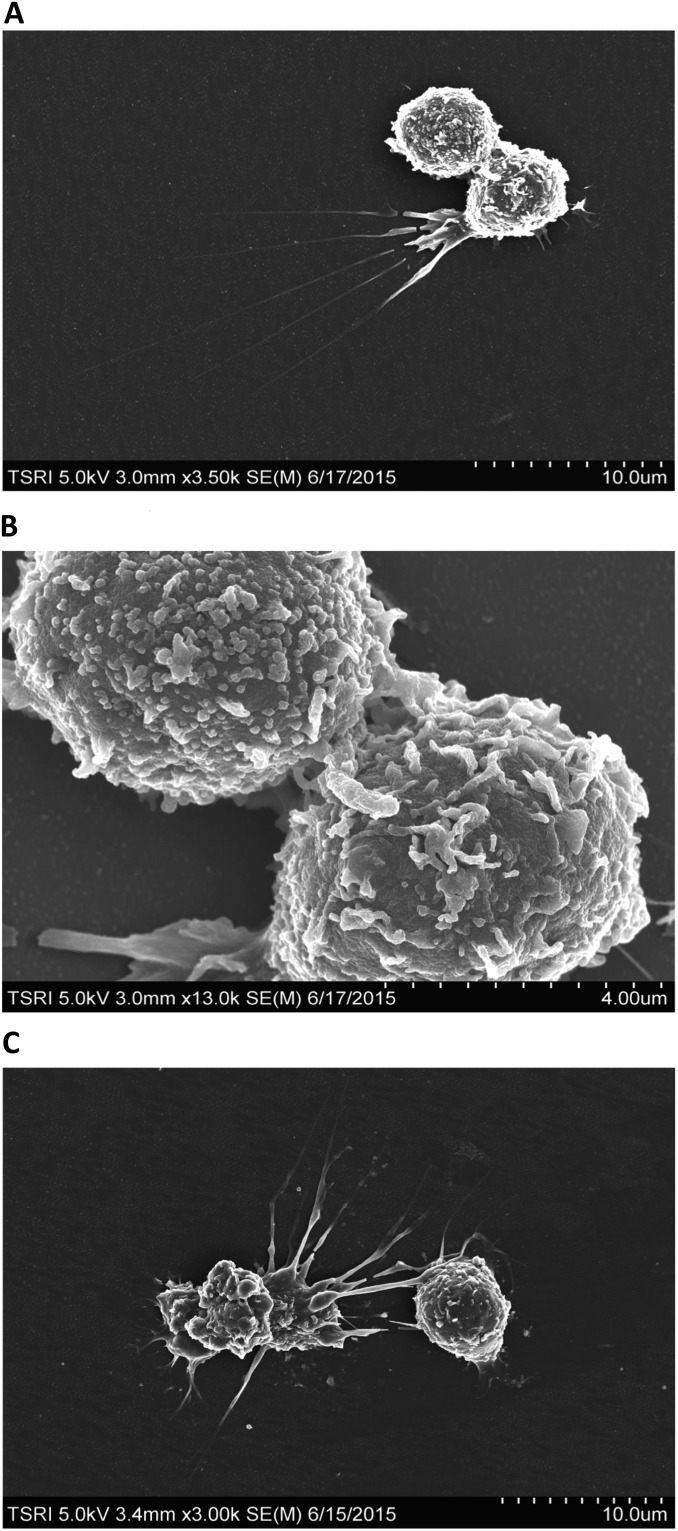
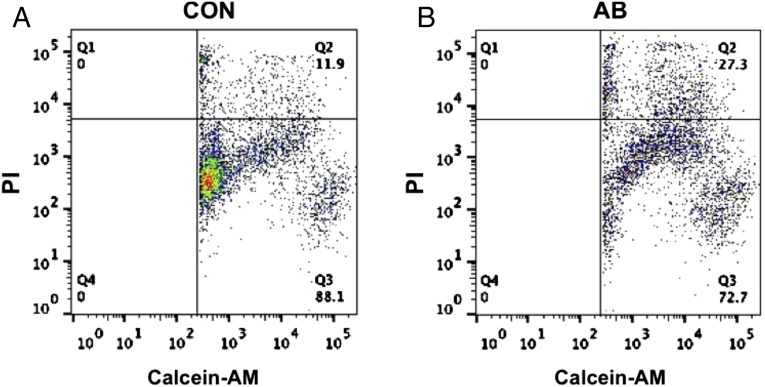
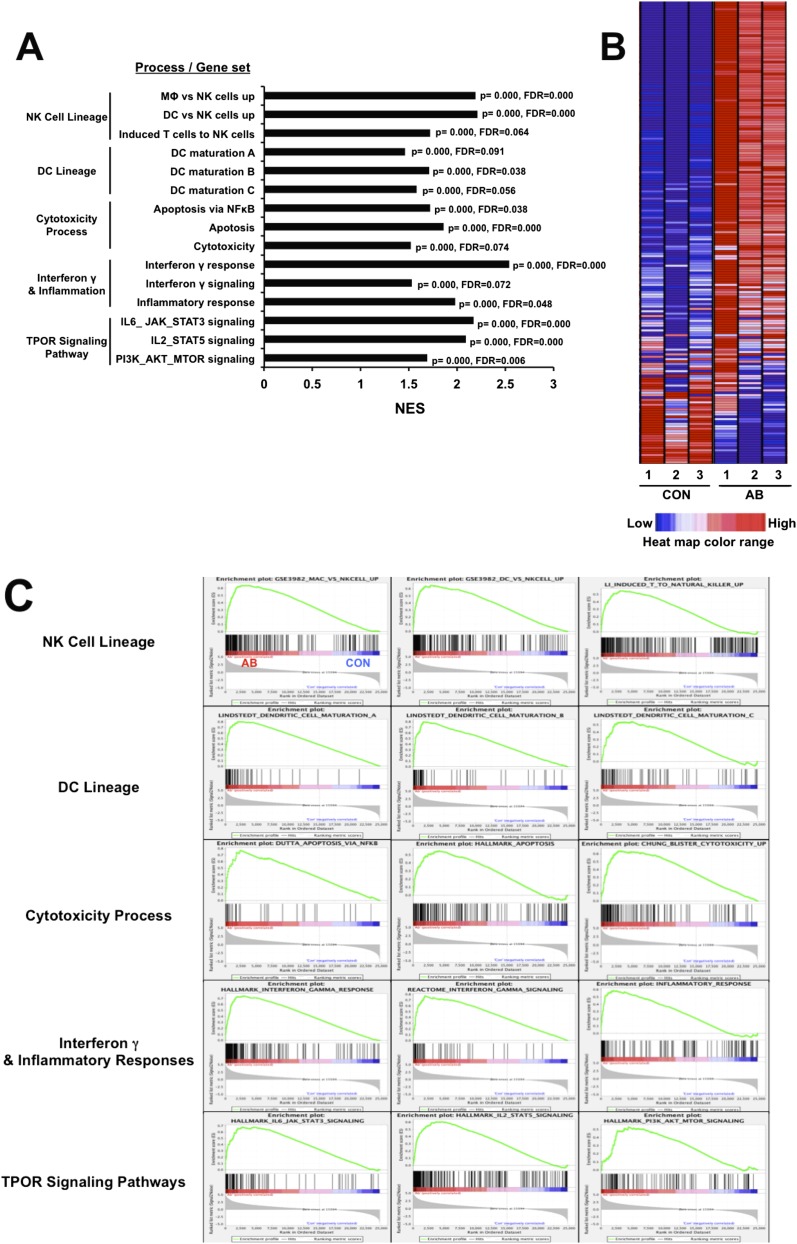
An attractive, but as yet generally unrealized, approach to cancer therapy concerns discovering agents that change the state of differentiation of the cancer cells. Recently, we discovered a phenomenon that we call "receptor pleiotropism" in which agonist antibodies against known receptors induce cell fates that are very different from those induced by the natural agonist to the same receptor. Here, we show that one can take advantage of this phenomenon to convert acute myeloblastic leukemic cells into natural killer cells. Upon induction with the antibody, these leukemic cells enter into a differentiation cascade in which as many as 80% of the starting leukemic cells can be differentiated. The antibody-induced killer cells make large amounts of perforin, IFN-γ, and granzyme B and attack and kill other members of the leukemic cell population. Importantly, induction of killer cells is confined to transformed cells, in that normal bone marrow cells are not induced to form killer cells. Thus, it seems possible to use agonist antibodies to change the differentiation state of cancer cells into those that attack and kill other members of the malignant clone from which they originate.

Keywords: agonist antibody; combinatorial antibody libraries; differentiation; natural killer cell.


Conflict of interest statement

Conflict of interest statement: R.A.L. is a founder of Zebra biologics.

Figures

Fig. S1.
Fig. S1.
(A) Normal BM CD34+ cells and AML cells after 4 d culture in the presence of PBS, antibody (10 μg/mL), or TPO (10 ng/mL). The red arrow indicates a megakaryocyte. The red-boxed Inset shows an enlarged image of a differentiated cell. (B) The AML cells after 4 d culture with various concentrations of antibody (1–100 μg/mL) or TPO (0–100 ng/mL). (C) Eight microscopic areas in each panel in B were chosen arbitrarily, and the differentiated cell numbers were counted. Significant differences (*P < 0.05) were evaluated by one-way ANOVA.
Fig. 1.
Fig. 1.
Antibody-induced differentiation of AML BM cells. (A and B) Images of AML BM cells after treatment with PBS or antibody (10 μg/mL) for 4 d by microscopy. The arrow in B shows cell blebbing after a cell has been penetrated by filopodia from an antibody-induced differentiated cell. (CE) Magnified images of fully differentiated cells in B. (F) Fluorescent microscopy images of the differentiated cells stained for CD11c (red). Nuclei were stained by Hoechst 33342 (blue). (G and H) Enlarged images of the CD11c+ differentiated cells.
Fig. 2.
Fig. 2.
The immunocytochemistry of differentiated AML cells. Nuclei were stained by Hoechst 33342 (blue). F-actin is labeled by rhodamine-phalloidin (red). (AC) Early-stage differentiated cells visualized by confocal microscopy. The differentiated cells were stained for perforin (A), IFN-γ (B), or granzyme B (C). (DF) Late-stage differentiated cells stained as in AC, respectively. The white arrow in D points to a target cell nucleus from which cytoplasm has been stripped.
Fig. 3.
Fig. 3.
Scanning electron microscopy analysis of NK cells interacting with a target cell. (A) A representative scanning electron microscopy image of an NK cell interacting with an AML target cell. The NK cell was induced by treatment with antibody for 4 d. (B and C) Enlarged images of the area boxed in red in A. The red arrow in C indicates the dendrites of the NK cell penetrating into the target cell.
Fig. 4.
Fig. 4.
Scanning electron microscopy analysis of an induced immature dendritic cell.
Fig. S2.
Fig. S2.
Deconvoluted images of the images in Fig. 2 AC, respectively. AC show the expression of perforin, interferon γ, and granzyme B, respectively.
Fig. S3.
Fig. S3.
Deconvoluted images of the images in Fig. 2 DF, respectively. AC show the expression of perforin, interferon gamma, and granzyme B, respectively.
Fig. S4.
Fig. S4.
Scanning electron microscopy analysis of differentiated cells. (A) Scanning electron microscopy analysis of an induced immature dendritic cell. (B) Enlarged image of the cell-to-cell interaction in A. (C) Scanning electron microscopy analysis of target cell capturing by NK cells. Note the length of the filopodia.
Fig. 5.
Fig. 5.
Cytotoxic activity of the antibody-induced differentiated cells. AML cells were labeled with calcein-AM and cocultured for 4 h at 37 °C with NK cells (A) or undifferentiated cells (B). At the end of the incubation, dead cells were labeled with PI. The percentage of AML cell death was analyzed by a flow cytometer.
Fig. 6.
Fig. 6.
Activation of TPOR signal transduction by antibody in AML cells. (A) After treatment with various doses of antibody or 10 ng/mL of TPO for 1 h, the phosphorylation of STAT-3, AKT, and ERK was analyzed by Western blotting using anti–p-STAT-3, anti–p-AKT, and anti–p-ERK antibodies. (B) TPOR signaling was tested at various times after antibody or TPO treatment. (C) The bands of AKT and p-AKT from B were analyzed quantitatively by densitometry (Image J). (D) AML cells after treatment with PBS or antibody (10 μg/mL) for 4 d in the presence of STAT-3, PI3K, or MAPK inhibitors. (E) The differentiated cell numbers were counted in eight arbitrarily chosen microscopic areas. Significant differences (*P < 0.05) were evaluated by one-way ANOVA.
Fig. S5.
Fig. S5.
Quantitative gene-expression analysis by RNAseq. The mRNA from three separate samples of control or antibody-treated AML cells was analyzed by whole-transcriptome sequencing. (A) A summary of key results for significantly enriched gene sets associated with the biological properties of NK cells or the TPOR signaling pathway. The normalized enrichment score (NES) accounts for differences in gene size and allows comparison across gene sets. (B) A representative heat map of the macrophage vs. NK cells gene set; red, up-regulated; blue, down-regulated. (C) Enrichment plots of GSEA key results. The results for significantly enriched gene sets associated with the biological process listed in A are shown. In the plots, all transcripts were statistically rank-ordered from left to right by decreasing relative expression level in antibody-treated vs. untreated cells. Gray histograms show phenotype correlation values for the ranked genes as signal-to-noise ratios. The histograms are positive for mRNAs enriched in antibody-treated samples and negative for mRNAs from untreated samples. Vertical lines above the histograms denote the positions of individual mRNAs within the considered gene set in the ranked list of all mRNAs. Red and blue horizontal bars mark mRNAs whose expression levels correlate positively (red) or negatively (blue) with the phenotype seen after antibody treatment. Green curves show running enrichment scores for the gene set as the analysis moves down the ranked gene list. Peak asymmetry correlates with enrichment (left shift) or underrepresentation (right shift) of the respective gene set in antibody-treated samples. FDR, false discovery rate; p, nominal P value.
Fig. S6.
Fig. S6.
IPA of the whole transcriptome. (A and B) Analysis of crosstalk between dendritic cells and natural killer cells. Transcriptomes of antibody-treated vs. untreated (A) or antibody-treated vs. TPO-treated samples (B) were analyzed. Up-regulated interactions are shown in red, and suppressed interactions are shown in green. Color intensity is relative to expression level. Genes along canonical pathways that were not changed at transcript level are not colored. The arrows point in the direction of positive regulation. (CG) Analyses of dendritic cell maturation (C), death receptor signaling (D), IFN-γ network (E), JAK-STAT signaling (F), and oxidative phosphorylation (G).

Comment in

Similar articles

Cited by

References

    1. Kershaw MH, Westwood JA, Darcy PK. Gene-engineered T cells for cancer therapy. Nat Rev Cancer. 2013;13(8):525–541. - PubMed
    1. Maus MV, Grupp SA, Porter DL, June CH. Antibody-modified T cells: CARs take the front seat for hematologic malignancies. Blood. 2014;123(17):2625–2635. - PMC - PubMed
    1. Waldhauer I, Steinle A. NK cells and cancer immunosurveillance. Oncogene. 2008;27(45):5932–5943. - PubMed
    1. Lanier LL. NK cell receptors. Annu Rev Immunol. 1998;16:359–393. - PubMed
    1. Childs RW, Carlsten M. Therapeutic approaches to enhance natural killer cell cytotoxicity against cancer: The force awakens. Nat Rev Drug Discov. 2015;14(7):487–498. - PubMed

Publication types

MeSH terms