. 2015 Oct 21;10(10):e0140969.
doi: 10.1371/journal.pone.0140969. eCollection 2015.

The Low Noise Limit in Gene Expression

Affiliations

The Low Noise Limit in Gene Expression

Roy D Dar et al. PLoS One. .

Abstract

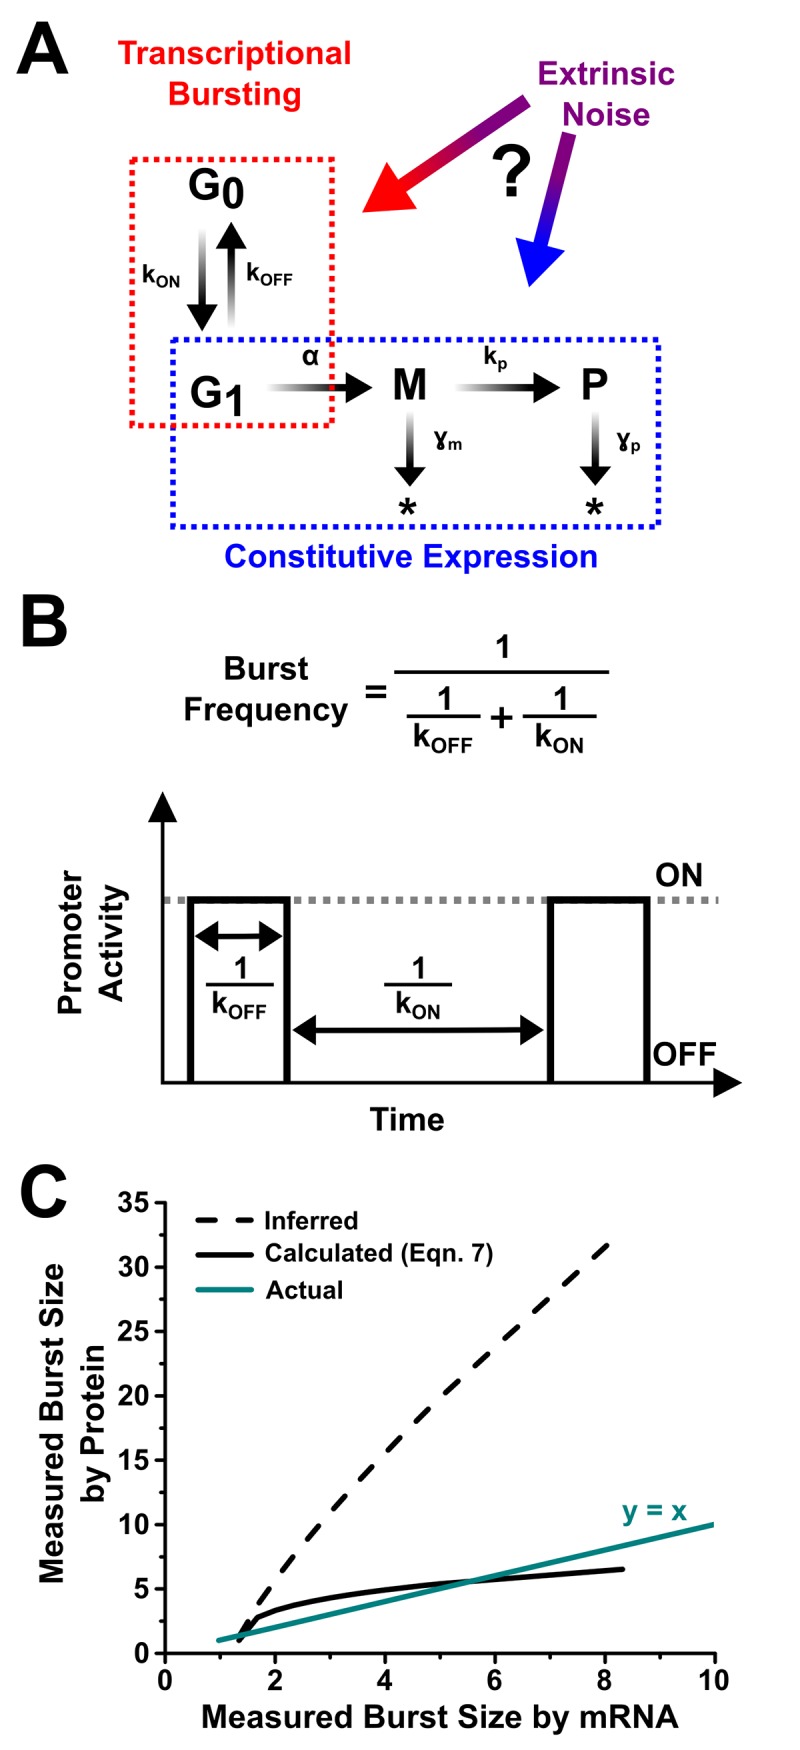
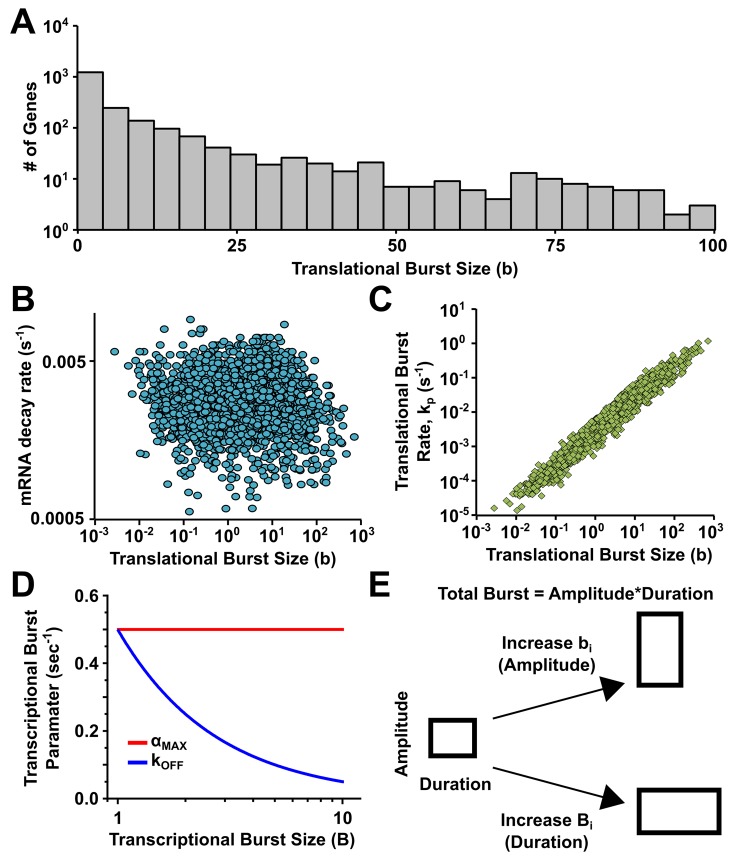
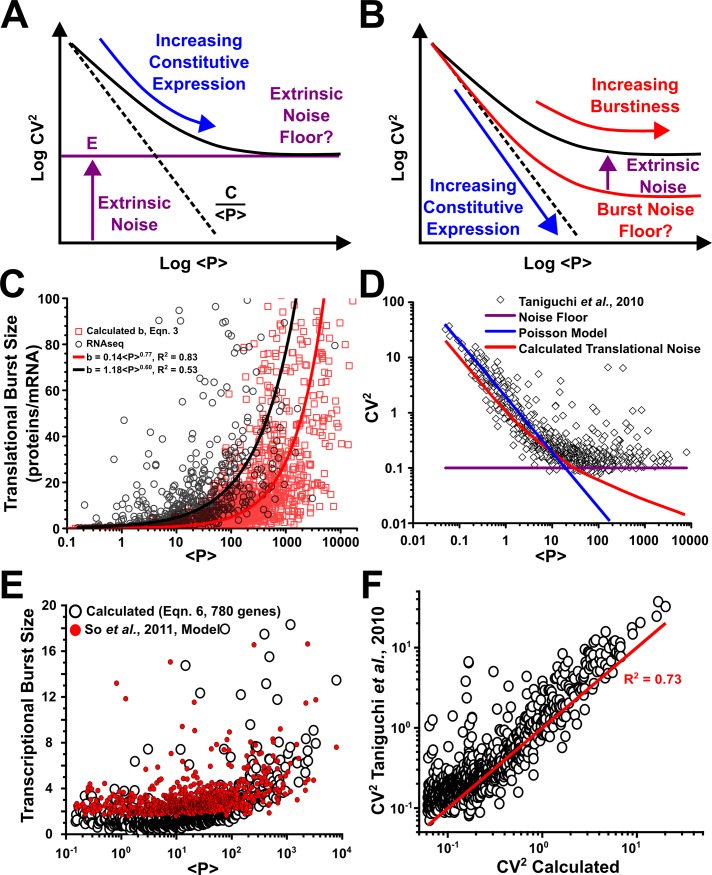
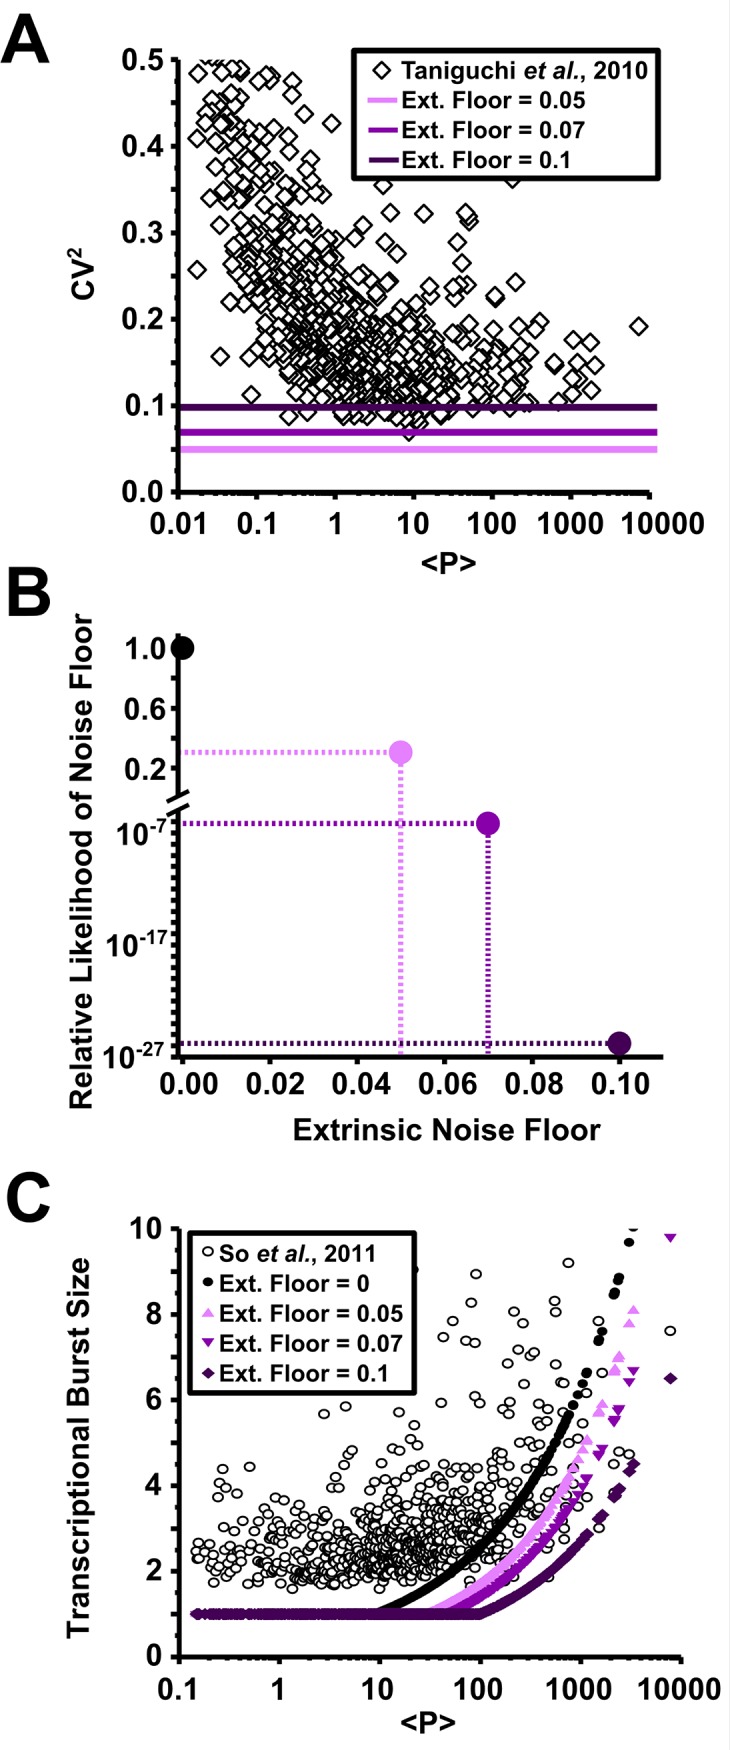
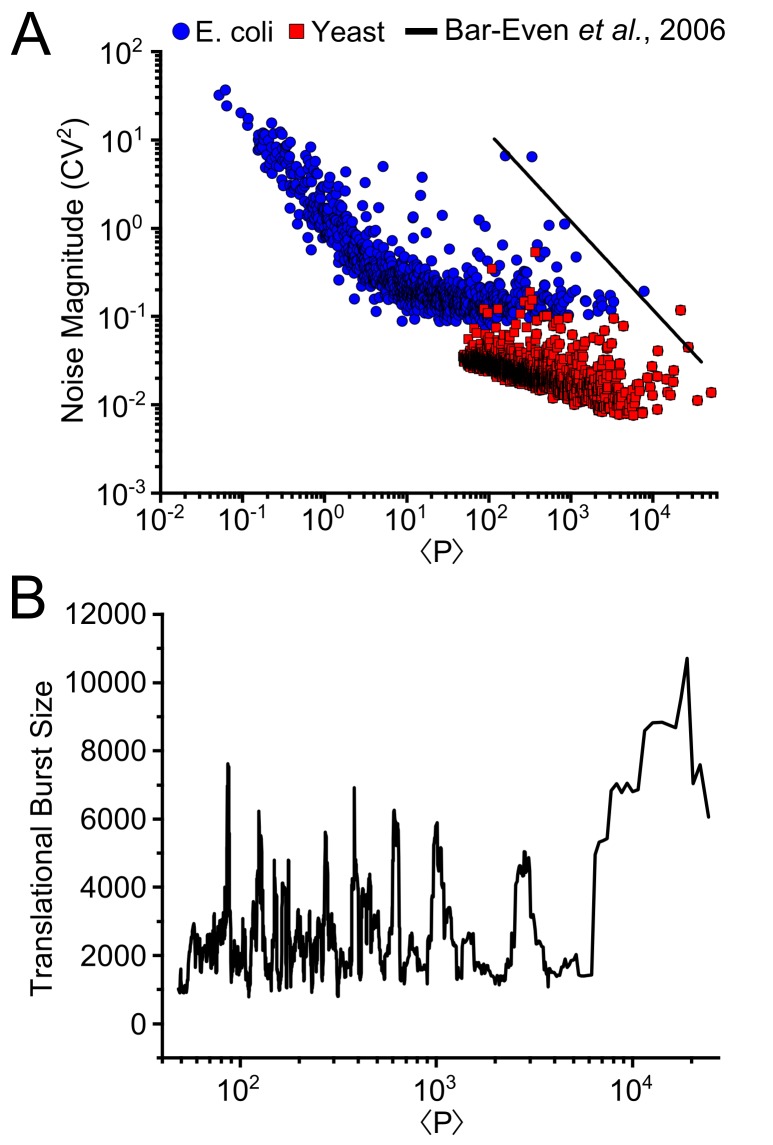
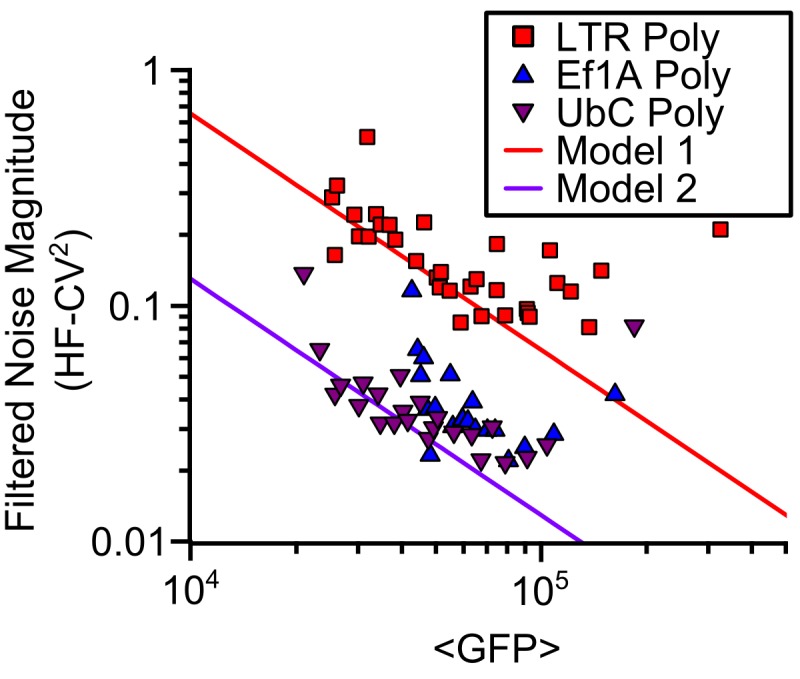
Protein noise measurements are increasingly used to elucidate biophysical parameters. Unfortunately noise analyses are often at odds with directly measured parameters. Here we show that these inconsistencies arise from two problematic analytical choices: (i) the assumption that protein translation rate is invariant for different proteins of different abundances, which has inadvertently led to (ii) the assumption that a large constitutive extrinsic noise sets the low noise limit in gene expression. While growing evidence suggests that transcriptional bursting may set the low noise limit, variability in translational bursting has been largely ignored. We show that genome-wide systematic variation in translational efficiency can-and in the case of E. coli does-control the low noise limit in gene expression. Therefore constitutive extrinsic noise is small and only plays a role in the absence of a systematic variation in translational efficiency. These results show the existence of two distinct expression noise patterns: (1) a global noise floor uniformly imposed on all genes by expression bursting; and (2) high noise distributed to only a select group of genes.


Conflict of interest statement

Competing Interests: The authors have declared that no competing interests exist.

Figures

Fig 1
Fig 1. Assumptions of extrinsic noise coupling reveal a disparity in inferred versus actual transcriptional burst size measurements.
(A) Transcriptional bursting (red dashed box) occurs when a promoter stochastically switches between an ‘OFF’, G0 state, and ‘ON’, G1 state, at rates k OFF and k ON. In the G1 state mRNA, M, is transcribed at rate α, and translated into protein, P, at rate k p. mRNA and protein decay at rates γm and γ p respectively. Constitutive expression (blue dashed box) is made of the processes of transcription from the G1 state, translation, and decay of M and P. Extrinsic noise, i.e. global fluctuations in shared resources, can potentially affect transcriptional bursting, constitutive expression, or both. (B) Schematic representation of promoter transitioning as a square wave where the average timing between bursts, TOFF, is 1/ k ON. The average duration of a burst, TON, i.e. time in the ON, G1 state, is 1/ k OFF. The average number of bursts over a length of time is termed the transcriptional burst frequency. (C) Measured transcriptional burst size by protein versus mRNA measurements. The inferred trend (dashed line) shows the discrepancy from the true values (y = x, cyan line). Calculated values based on the corrected and reported model agrees well with the true values (solid line).
Fig 2
Fig 2. Expression pulse duration is set by transcriptional bursting and pulse intensity is set by translational bursting.
(A) Histogram of the number of genes with a given translational burst size. (B) Plot of the relationship between translational burst size, b, and the mRNA half-life, γ m, for 2077 mRNA in E. coli. (C) Plot of the relationship between translational burst size, b, and the translational burst rate, k p, for 2077 mRNA in E. coli. (D) Plot of the relationship between transcription rate, α (red), and the rate of promoters transitioning into the OFF, G0 state, k OFF (blue), versus the range of calculated B in Fig 3. Here transcription rate was assumed near the maximal physiological limit [15] and kOFF was calculated accordingly. (E) Total expression burst is determined by the duration and amplitude of transcription and translation. Transcription predominately sets duration while translation sets amplitude.
Fig 3
Fig 3. Bursty expression increases with abundance and determines the noise structure observed throughout the E. coli genome.
(A) Traditionally, in a plot of CV2 versus abundance, <P>, noise in gene-expression is thought to scale as C/<P> (dashed line) and extrinsic noise creates a floor (purple line) with height E. (B) Alternatively, the noise floor can be set by increasing burstiness in gene expression for increasing abundance. Extrinsic noise (purple arrow) coupling into bursty expression would increase the level, but not set the noise floor. (C) Translational burst sizes versus abundance of the E. coli proteome (black circles and red squares) fit to power functions. Circles represent the calculated values from Eq 3. Squares represent previously reported RNAseq measurements [4]. (D) Plot of CV2 and <P> for proteomic E. coli data (black diamonds, [4]). The calculated translational burst noise (red line) is generated by holding B constant (= 1) and only modulating b. Poisson model (blue line) and noise floor (purple line) are also shown. (E) Plot of transcriptional burst size (Bi) from Eq 6 for 780 genes (open circles) compared to model of measured results from So et al. (filled red circles, [15]). (F) Plot of measured noise from Taniguchi et al. [4], versus the calculated noise (Eq 8) based on fits from (C) and (E).
Fig 4
Fig 4. The noise floor is not determined by extrinsic noise acting alone; rather noise from bursty gene expression dominates.
(A) Illustration of noise floors resulting from various levels of extrinsic noise. (B) Relative likelihood of gene expression noise models with various levels of extrinsic noise as evaluated by the Akaike information criteria [45]. The model with extrinsic noise E = 0 has the highest likelihood; models with E = 0.07 and E = 0.1 have extremely low likelihood. (C) Transcriptional burst size (B) corresponding to different levels of assumed extrinsic noise. Burst size corresponding to larger noise floors are incompatible with values calculated from the experimentally based model of So et al. (2011).
Fig 5
Fig 5. Yeast shows less burstiness and no noise floor compared to E. coli.
(A) Reported noise magnitude measurements for 1467 genes of S. cerevisiae plotted along with genome-wide E. coli noise measurements from Fig 3D. (B) Using calculated values for translational burst size [1] based off of four separate databases [–50], in contrast to E. coli, the translational burst size are invariant to protein abundance. A moving average of 20 genes was applied to the trend.
Fig 6
Fig 6. Evidence of the noise floor at high abundance in mammalian cells.
Polyclonal populations of T cells infected with a viral HIV-LTR and housekeeping promoters, UbC and Ef1A, show an increase of noise at higher abundances. Time-lapse microscopy and signal processing of limited duration experiments filters extrinsic noise (High-frequency or HF-CV2, [6]) suggesting that burstiness drives the noise increase from a simple model line that is inversely proportional to mean GFP. Data adapted from Dar et al., 2012, [6].

Similar articles

Cited by

References

    1. Cox CD, McCollum JM, Allen MS, Dar RD, Simpson ML. Using noise to probe and characterize gene circuits. Proceedings of the National Academy of Sciences of the United States of America. 2008;105(31):10809–14. 10.1073/pnas.0804829105 - DOI - PMC - PubMed
    1. Lipinski-Kruszka J, Stewart-Ornstein J, Chevalier MW, El-Samad H. Using Dynamic Noise Propagation to Infer Causal Regulatory Relationships in Biochemical Networks. ACS Synth Biol. 2014. Epub 2014/06/27. 10.1021/sb5000059 . - DOI - PMC - PubMed
    1. Sanchez A, Golding I. Genetic determinants and cellular constraints in noisy gene expression. Science. 2013;342(6163):1188–93. Epub 2013/12/07. 10.1126/science.1242975 . - DOI - PMC - PubMed
    1. Taniguchi Y, Choi PJ, Li GW, Chen HY, Babu M, Hearn J, et al. Quantifying E-coli Proteome and Transcriptome with Single-Molecule Sensitivity in Single Cells. Science. 2010;329(5991):533–8. 10.1126/science.1188308 . - DOI - PMC - PubMed
    1. Carey LB, van Dijk D, Sloot PM, Kaandorp JA, Segal E. Promoter sequence determines the relationship between expression level and noise. PLOS Biology. 2013;11(4):e1001528 Epub 2013/04/09. 10.1371/journal.pbio.1001528 - DOI - PMC - PubMed

Publication types

MeSH terms

Substances

LinkOut - more resources