. 2015 Oct 21;11(10):e1004280.
doi: 10.1371/journal.pcbi.1004280. eCollection 2015 Oct.

Crawling and Gliding: A Computational Model for Shape-Driven Cell Migration

Affiliations

Crawling and Gliding: A Computational Model for Shape-Driven Cell Migration

Ioana Niculescu et al. PLoS Comput Biol. .

Abstract

Cell migration is a complex process involving many intracellular and extracellular factors, with different cell types adopting sometimes strikingly different morphologies. Modeling realistically behaving cells in tissues is computationally challenging because it implies dealing with multiple levels of complexity. We extend the Cellular Potts Model with an actin-inspired feedback mechanism that allows small stochastic cell rufflings to expand to cell protrusions. This simple phenomenological model produces realistically crawling and deforming amoeboid cells, and gliding half-moon shaped keratocyte-like cells. Both cell types can migrate randomly or follow directional cues. They can squeeze in between other cells in densely populated environments or migrate collectively. The model is computationally light, which allows the study of large, dense and heterogeneous tissues containing cells with realistic shapes and migratory properties.


Conflict of interest statement

The authors have declared that no competing interests exist.

Figures
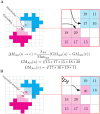
Fig 1
Fig 1. Example of a CPM copy attempt with the Act model.
In the Act model, we encourage copying from sites with relatively high activity values to sites with lower values. (A) The magenta cell is attempting to copy itself into the cyan cell by extending from lattice site u into the lattice site v. The right inset magnifies the intracellular neighborhoods of u (light magenta) and v (light cyan); the lattice sites contain examples of activity values. We obtain GMAct(u) and GMAct(v) by geometrically averaging over the activity values of each neighborhood, and we calculate ΔHAct from the difference of these values. The success probability of the copy attempt is biased by subtracting ΔHAct from ΔH. In this example (i.e., MaxAct = 20, λ Act > 0), ΔHAct(uv)=λAct1.4620>0 which increases the chance of accepting the copy attempt. (B) If the copy attempt is successful, v is incorporated into the magenta cell and the site is assigned the maximum activity value (in this case, MaxAct = 20).
Fig 2
Fig 2. Random breaking of symmetry results in polarization.
Time series of the initiation of a protrusion within the Act model. At time t = 0 MCSs, the cell asserts random membrane fluctuations with no clear bias towards any direction. At t = 5 MCSs, a small protrusion starts forming at the bottom of the cell. Due to a consistently active neighborhood at the protrusion, the positive feedback is encouraging it to extend further. Within the protrusion a gradient of activity values develops resembling the treadmilling of the actin network [21].
Fig 3
Fig 3. The Act model reproduces amoeboid and keratocyte-like behavior.
(A) Typical appearance and migration behavior of an amoeboid cell; cell track in red. (B) Typical appearance and migration behavior of a keratocyte-like cell. The colorbars represent the activity values scaled from 0 (green) to MaxAct (red). (C) Traces of the instantaneous migration features corresponding to the amoeboid cell in (A). (D) Traces of the instantaneous migration features corresponding to the keratocyte-like cell in (B). Vertical gray lines highlight the time points at which the cell snapshots were taken. Red dashed lines show the average values of the migration features calculated over the whole track. See Methods section for definitions of measurements and for the complete list of parameter values.
Fig 4
Fig 4. Amoeboid to keratocyte-like transition.
(A) Low orientation-migration angles are typical for amoeboid cells (green region); high ones indicate transversal migration which is typical for the keratocyte-like cells (yellow region). For large enough λ Act, there is a transition between amoeboid behavior at low MaxAct values and keratocyte-like behavior at high MaxAct values. λ Act amplifies the amoeboid or keratocyte-like behavior, but cannot trigger a switch from one type of behavior to another on its own (e.g., no λ Act value combined with a low MaxAct will result in keratocyte-like behavior). Every point in the graph represents the mean of 10 experiments of 30.000 MCSs each with sampling time Δt = 20 MCSs between consecutive measurements. The shadows represent the standard deviations. (B) Morphospace of the Act model illustrating cell behavior at different combinations of parameter values. Every cell is showed at two positions along its track, except for the non-migrating cells. At λ Act = 10 the cells are roundish and stationary: very similar to the basic CPM cells. At high λ Act values and low MaxAct values the cells are amoeboid; at high λ Act values and high MaxAct values the cells are keratocyte-like (see also S2 Video). See Methods section for definitions of measurements and for the complete list of parameter values.
Fig 5
Fig 5. Migration features of cells in the Act model.
Increasing the MaxAct and λ Act parameters makes cells (A) more persistent, (B) more motile, and (C) longer. (D) The average turning angle of the cells decreases with both MaxAct and λ Act from the random 90 degrees (typical for the jiggling of the basic CPM cells) to average values as low as 20 degrees as the cells migrate more organized. (E) The instantaneous speed of cells initially increases with MaxAct and λ Act, then decreases. The first point on the x axis represents the original CPM setting, without the Act model, i.e λ Act = 0, MaxAct = undefined. The migration features were extracted from single cell experiments. Every point in a graph represents the mean of 10 simulations of 30.000 MCSs each with sampling time Δt = 20 MCSs between consecutive measurements. The shadows represent the standard deviation. See Methods section for definitions of measurements and for the complete list of parameter values.
Fig 6
Fig 6. Amoeboid and keratocyte chemotaxis.
(A) Amoeboid cells (λ Act = 200, MaxAct = 20) and (B) keratocyte-like cells (λ Act = 200, MaxAct = 80) were placed in linear chemokine gradients (slope 0.33, λ Chemotaxis = 150) along the y axis (white to black gradient). Cell tracks are colored in red. See also the corresponding movies S5 and S6 Videos.
Fig 7
Fig 7. The direction of cell protrusions is biased by the chemotaxis strength.
Amoeboid cells (λ Act,MaxAct = 20) were placed in chemokine gradients at different values of the chemotaxis strength (λ Chemotaxis). For every value of λ Chemotaxis, we conducted 25 independent simulations resulting in 25 images of single cells on which we performed image segmentation to extract the protrusions. The number of protrusions and the angles they made with the chemokine gradient were averaged over the 25 experiments. The average protrusion-gradient angle decreases as λ Chemotaxis increases, while the average number of simultaneous cell protrusions remains constant (1.6 protrusions).
Fig 8
Fig 8. The Act model makes cells more sensitive to chemotaxis.
Basic CPM cells (λ Act = 0), amoeboid cells (λ Act = 200, MaxAct = 20) and keratocyte-like cells (λ Act = 200, MaxAct = 80) were placed in chemotactic gradients. The average instantaneous speed and the average directed speed were measured for different values of the chemotaxis strength parameter (λ Chemotaxis). Every point in a graph is the average of 300 single cell simulations of 5000 MCSs each with sampling time Δt = 20 MCSs between consecutive measurements. The blue, red and green shadows represent the standard deviations. (A) The speed of cells increases with increasing λ Chemotaxis values; the speed of the amoeboid cell grows much faster than that of the keratocyte-like cells. (B) The speed up the chemokine gradient is growing with λ Chemotaxis. (C) The Act model makes keratocyte-like and amoeboid cells more sensitive to the chemokine gradient; they migrate more directionally than the basic CPM cells at low values of λ Chemotaxis. (D) The directed speed of the keratocyte is higher when cells have the same speed (yellow highlighted region). See Methods section for definitions of measurements and for the complete list of parameter values.
Fig 9
Fig 9. Collective migration of the Act cells.
(A,B) Heatmaps (left column) and plots (right column) of the order index for Act cells with MaxAct = 20 (A) or MaxAct = 80 (B). The order index (see Methods) ranges from 0 (complete random migration) to 1 (completely collective migration). The color in the heatmaps ranges from yellow (order index 0) to red (order index 0.8). Act cells were placed on the lattice at different coverages and different cell-cell adhesion values, and, after a period of relaxation, the mean order index was calculated for every experiment (see Methods). Every tile in the heatmaps and every point in the plots represent the average of 30 simulations. The heatmaps are annotated with the names of the videos corresponding to the particular parameters set of the tile. (C) Representative snapshots of S8 Video (left), S9 Video (middle), and S10 Video (right). See Methods section for the complete list of parameter values.
Fig 10
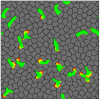
Fig 10. Effector T cells patrolling in the tightly packed environment of the epidermis.
In silico skin cells (gray) and T cells (green) were seeded at 100% lattice coverage on a wrapped lattice. The T cells are extending protrusions (yellow to red gradient) and squeeze between skin cells by pushing them apart (see also S7 Video). See Methods section for the complete list of parameter values.
Fig 11
Fig 11. Influence of environment on the migration and scanning properties of Act cells.
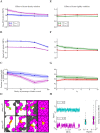
Effects of variations in tissue density (A-D) and in tissue rigidity (E-H) on migrating cells within the amoeboid (MaxAct = 20) and keratocyte-like (MaxAct = 80) parameter range. The results represent the average of 20 experiments of 20000 MCSs each, with a sampling time Δt = 20 MCSs between consecutive measurements of cell position. In each experiment, one Act cell was placed on a dish containing non-Act cells seeded at different densities (A-D), or on a dish with non-Act cells at 100% density with different rigidities (E-H). The rigidity of the tissue formed by non-Act cells is controlled by the perimeter constraint (λ Perimeter). The higher λ Perimeter, the stricter cells keep to their target perimeter, and the less they tend to deform. (A, E) Migration persistence. (B, F) Instantaneous speed. (C, G) The fraction of tissue cells scanned by the Act cell. A cell is scanned if it has been in contact with the Act cell at least once. (D) Typical morphologies of Act cells (green with yellow to red protrusions) at different tissue densities. The tissue cells that have been scanned by the Act cell are colored magenta, non-scanned cells are gray. (H) (Left) Speed traces of two cells in the amoeboid range (MaxAct = 20), one migrating in flexible tissue (λ Perimeter = 0) and the other one in rigid tissue (λ Perimeter = 10). The red dashed lines delimit the speed thresholds under which the cells were considered stationary. (Right) Boxplots of the stop durations (in MCSs) corresponding to the speed traces in the left panel. Yellow stars indicate means. See Methods section for a more detailed explanation of the experiments and for the complete list of parameter values.
Fig 12
Fig 12. Computational performance of the Act model.
(A) The CPU time of the CPM with and without the Act model was measured for simulations of migrating keratocytes (Fig 9) during 3000 MCSs. The computational performance is calculated as CPU time per MCS, averaged over 5 simulations. (B) The ratio performance is the ratio of the performance of the CPM with the Act model to the performance of the CPM alone (at the same number of cells). The performance of the Act model is comparable with that of the basic CPM. The Act model increases the CPU time of the CPM by around 10% and this percentage of extra cost remains constant with increasing cell numbers. Shadows represent the standard deviation. See Methods section for the complete list of parameter values.

Similar articles

Cited by

References

    1. Friedl P, Wolf K. Plasticity of cell migration: a multiscale tuning model. The Journal of Cell Biology. 2010;188(1):11–19. Available from: http://jcb.rupress.org/content/188/1/11.abstract. 10.1083/jcb.200909003 - DOI - PMC - PubMed
    1. Keren K, Pincus Z, Allen GM, Barnhart EL, Marriott G, Mogilner A, et al. Mechanism of shape determination in motile cells. Nature. 2008. May;453(7194):475–480. 10.1038/nature06952 - DOI - PMC - PubMed
    1. Lee J, Ishihara A, Theriot J, Jacobson K. Principles of locomotion for simple-shaped cells. Nature. 1993. March;362(6416):167–171. Available from: 10.1038/362167a0. - DOI - PubMed
    1. Lämmermann T, Sixt M. Mechanical modes of ‘amoeboid’ cell migration. Current Opinion in Cell Biology. 2009;21(5):636–644. Available from: http://www.sciencedirect.com/science/article/pii/S0955067409001148. 10.1016/j.ceb.2009.05.003 - DOI - PubMed
    1. Gebhardt T, Wakim LM, Eidsmo L, Reading PC, Heath WR, Carbone FR. Memory T cells in nonlymphoid tissue that provide enhanced local immunity during infection with herpes simplex virus. Nat Immunol. 2009. May;10(5):524–530. 10.1038/ni.1718 - DOI - PubMed

Publication types

LinkOut - more resources