

Left Atrial 4-Dimensional Flow Magnetic Resonance Imaging: Stasis and Velocity Mapping in Patients With Atrial Fibrillation
- PMID: 26488375
- PMCID: PMC4742429
- DOI: 10.1097/RLI.0000000000000219
Left Atrial 4-Dimensional Flow Magnetic Resonance Imaging: Stasis and Velocity Mapping in Patients With Atrial Fibrillation
Abstract
Objectives: Left atrial (LA) 4-dimensional flow magnetic resonance imaging (MRI) was used to derive anatomic maps of LA stasis, peak velocity, and time-to-peak (TTP) velocity in patients with atrial fibrillation (AF) and to identify relationships between LA flow with LA volume and patient characteristics.
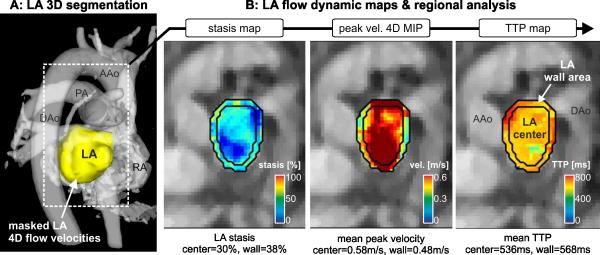
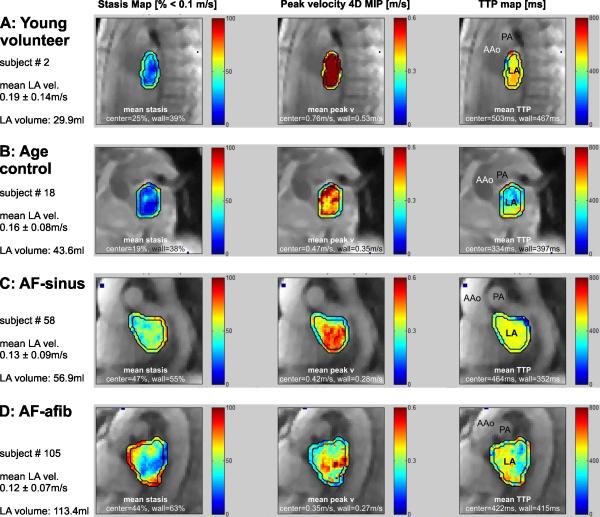
Materials and methods: Four-dimensional flow MRI for the in vivo assessment of time-resolved 3-dimensional LA blood flow velocities was performed in 111 subjects: 42 patients with a history of AF and in sinus rhythm (AF-sinus), 39 patients with persistent AF (AF-afib), 10 young healthy volunteers (HVs), and 20 age-appropriate controls (CTRL). Data analysis included the 3-dimensional segmentation of the LA and the calculation of LA stasis, peak velocity, and TTP maps. Regional LA flow dynamics were quantified by calculating mean stasis, peak velocity, and TTP in the LA center region and the region adjacent to the LA wall.
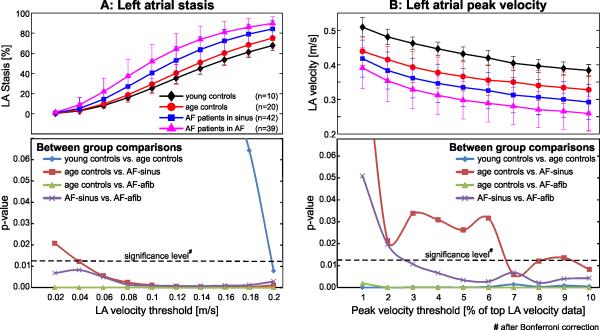
Results: A sensitivity analysis identified thresholds for global LA stasis (<0.1 m/s) and peak velocity (top 5% LA velocities), which detected significant differences between AF patients and controls for global LA stasis (HV, 25% ± 5%; CTRL, 29% ± 10%; AF-sinus, 41% ± 13%; AF-afib, 52% ± 17%) and peak velocity (HV, 0.43 ± 0.02 m/s; CTRL, 0.37 ± 0.04 m/s; AF-sinus, 0.33 ± 0.05 m/s; AF-afib, 0.30 ± 0.05 m/s). Regional analysis revealed significantly increased stasis at both LA center and wall for AF patients compared with age-appropriate controls (29%-84% difference, P < 0.006) and for AF-afib versus AF-sinus patients (22%-30% difference, P < 0.004). In addition, stasis close to the LA wall was significantly elevated (P < 0.001) compared with the LA center for all subject groups. Multiple regressions revealed significant (RAdj = 0.45-0.50, P < 0.001) relationships between impaired global LA flow (reduced velocity and increased stasis) with age (|β| = 0.27-0.50, P < 0.002) and LA volume (|β| = 0.26-0.50, P < 0.003).
Conclusions: Atrial 4-dimensional flow MRI detected changes in global and regional LA flow dynamics associated with AF, age, and LA volume. Longitudinal studies are needed to test the diagnostic value of LA flow metrics as potential risk factors for thromboembolic events.
Figures

References
-
- Fuster V, Ryden LE, Cannom DS, et al. 2011 accf/aha/hrs focused updates incorporated into the acc/aha/esc 2006 guidelines for the management of patients with atrial fibrillation: A report of the american college of cardiology foundation/american heart association task force on practice guidelines. Circulation. 2011;123:e269–367. - PubMed
-
- Goldman ME, Pearce LA, Hart RG, et al. Pathophysiologic correlates of thromboembolism in nonvalvular atrial fibrillation: I. Reduced flow velocity in the left atrial appendage (the stroke prevention in atrial fibrillation [spaf-iii] study). J Am Soc Echocardiogr. 1999;12:1080–1087. - PubMed
-
- Handke M, Harloff A, Hetzel A, et al. Left atrial appendage flow velocity as a quantitative surrogate parameter for thromboembolic risk: Determinants and relationship to spontaneous echocontrast and thrombus formation--a transesophageal echocardiographic study in 500 patients with cerebral ischemia. J Am Soc Echocardiogr. 2005;18:1366–1372. - PubMed
-
- Pollick C, Taylor D. Assessment of left atrial appendage function by transesophageal echocardiography. Implications for the development of thrombus. Circulation. 1991;84:223–231. - PubMed
Publication types
MeSH terms
Substances
Grants and funding
LinkOut - more resources
Full Text Sources
Other Literature Sources
Medical
