. 2015 Oct 20;109(8):1565-73.
doi: 10.1016/j.bpj.2015.08.038.

Characterizing Cellular Biophysical Responses to Stress by Relating Density, Deformability, and Size

Affiliations

Characterizing Cellular Biophysical Responses to Stress by Relating Density, Deformability, and Size

Sangwon Byun et al. Biophys J. .

Abstract

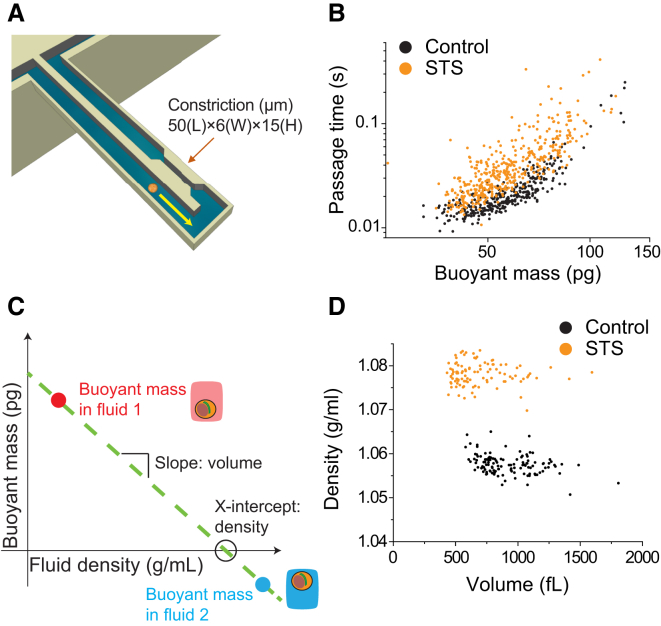
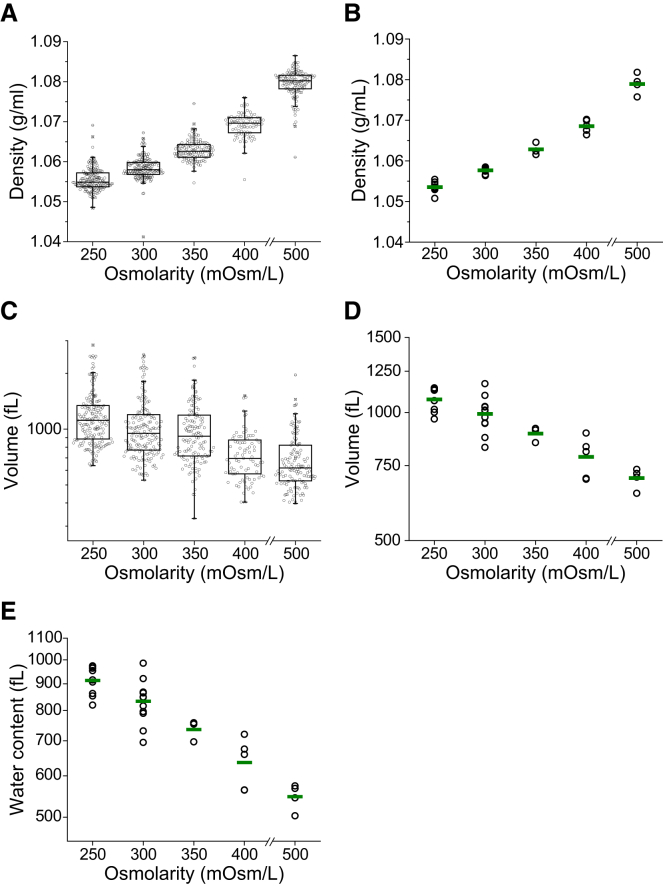
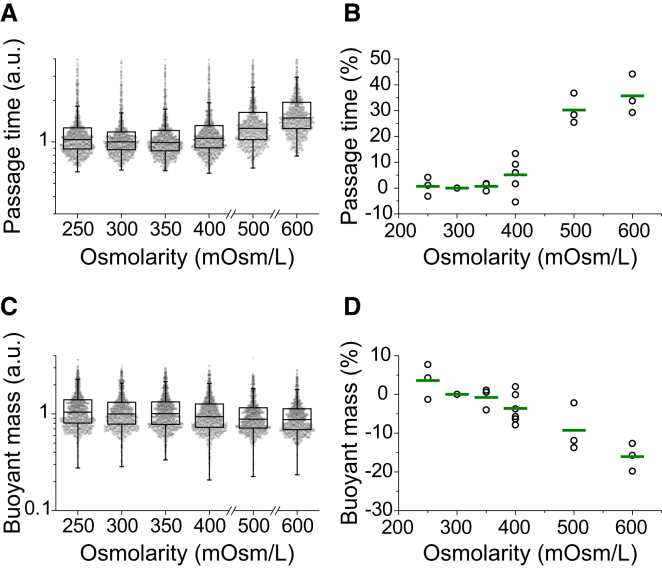
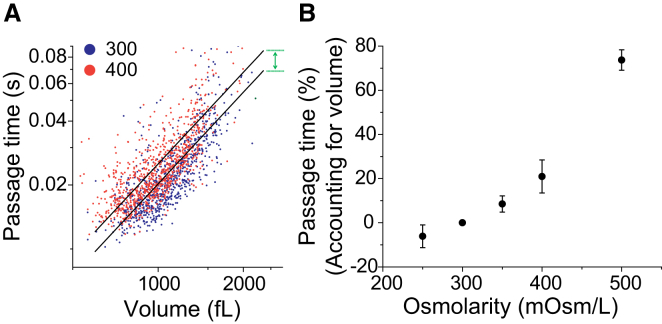
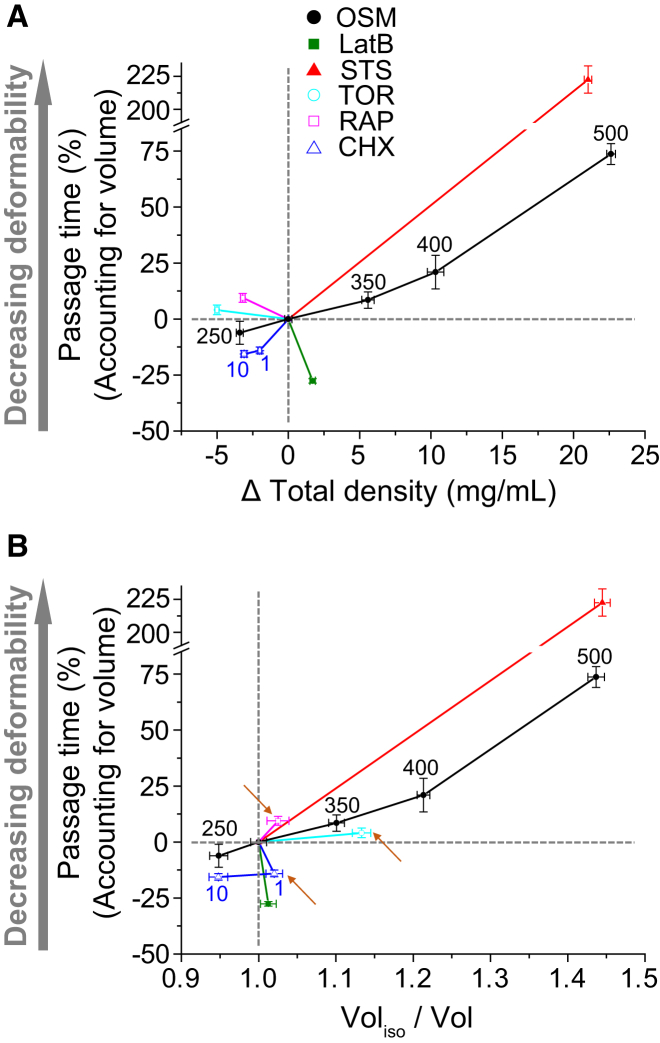
Cellular physical properties are important indicators of specific cell states. Although changes in individual biophysical parameters, such as cell size, density, and deformability, during cellular processes have been investigated in great detail, relatively little is known about how they are related. Here, we use a suspended microchannel resonator (SMR) to measure single-cell density, volume, and passage time through a narrow constriction of populations of cells subjected to a variety of environmental stresses. Osmotic stress significantly affects density and volume, as previously shown. In contrast to density and volume, the effect of an osmotic challenge on passage time is relatively small. Deformability, as determined by comparing passage times for cells with similar volume, exhibits a strong dependence on osmolarity, indicating that passage time alone does not always provide a meaningful proxy for deformability. Finally, we find that protein synthesis inhibition, cell-cycle arrest, protein kinase inhibition, and cytoskeletal disruption result in unexpected relationships among deformability, density, and volume. Taken together, our results suggest that by measuring multiple biophysical parameters, one can detect unique characteristics that more specifically reflect cellular behaviors.


Figures

Figure 1
Figure 1
Schematic diagrams of the approaches used to measure deformability, density, and volume, and examples of the data extracted from the measurements. (A) An SMR with a constriction measures the passage time and buoyant mass as a cell flows into an embedded microfluidic channel and transits through the constriction. (B) Passage time versus buoyant mass for the FL5.12 cell line shows the change in passage time induced by staurosporine (STS). (C) Measuring the buoyant mass of a single cell in two fluids of different densities allows the cell density and volume to be determined. (D) Cell density versus volume of FL5.12 cells treated with STS. Treatment with STS leads to an increase in density and a slight decrease in volume. To see this figure in color, go online.
Figure 2
Figure 2
Effect of osmotic stress on density and volume. FL5.12 cells are incubated in hypo- and hyperosmolar media for 30 min before and during the measurement. (A) Boxplots of density from a representative experiment. Each data point represents the density of an individual cell (n = 83–170). (B) Density changes resulting from osmotic stress across multiple replicates. A single point represents the geometric mean of one replicate and the green line indicates the mean from multiple replicates (n = 3–8 for each condition). (C) Boxplots of volume from a representative experiment. The data shown were measured simultaneously with density in (A). Each data point represents the volume of an individual cell. (D) Volume changes resulting from osmotic stress across multiple replicates. A single point represents the geometric mean of one replicate and the green line indicates the mean from all replicates (n = 3–8 for each condition). (E) Changes in cellular water content resulting from osmotic stress across multiple replicates. A single point represents the geometric mean of one replicate, and the green line indicates the mean from all replicates (n = 3–8 for each condition). To see this figure in color, go online.
Figure 3
Figure 3
Effect of osmotic stress on passage time and buoyant mass. FL5.12 cells were incubated in hypo- and hyperosmolar media for 30 min before and during the measurement. Passage time and buoyant mass were relatively unaffected by osmotic stress at 250, 350, and 400 mOsm/L. (A) Boxplots of passage time scaled by the median of the control (300 mOsm/L). Each data point represents the passage time of an individual cell (n = 972–1101). (B) Percentage change in the median passage time. The median passage time from each condition is normalized by the median of the control. A single point represents one replicate and the green line indicates the mean from multiple replicates (n = 3–6 for each condition). (C) Boxplots of buoyant mass scaled by the median of the control. The data shown were measured simultaneously with passage time in (A). Each data point represents the buoyant mass of an individual cell. (D) Percentage change in the median buoyant mass. The median buoyant mass from each condition is normalized by the median of the control. A single point represents one replicate and the green line indicates the mean from multiple replicates (n = 3–6 for each condition). To see this figure in color, go online.
Figure 4
Figure 4
Determining deformability from passage time by accounting for cell volume. Volume is obtained by converting single-cell buoyant mass data using the population average density. (A) Passage time versus volume from the two data sets (from Fig. 3, isoosmotic and hyperosmotic conditions) in a log-log scale is fitted to the linear models (black lines) with a fixed slope and variable intercepts corresponding to the two conditions. The deformability is determined by the ratio of passage times given the same cell volume, which is acquired from the difference between the two intercepts (green arrow). (B) Dependence of deformability (percentage change in passage time based on cell volume) on the osmolarity of the media. The data used are the same as shown in Fig. 3. To see this figure in color, go online.
Figure 5
Figure 5
Deformability versus density and volume for various conditions: osmotic challenge (250, 350, 400, and 500 mOsm/L), latrunculin B (LatB), staurosporine (STS), 1 μg/mL and 10 μg/mL of cycloheximide (CHX), rapamycin (Rap), and Torin 1 (Tor). Changes in deformability, density, and volume after treatments are quantified based on the isoosmotic control (untreated, 300 mOsm/L) in each experiment. Plots are divided into four quadrants, defined by two gray dotted lines. (A) The percentage change in passage time accounting for volume is plotted versus the change in density. The correlation between changes in deformability and density depends on the mechanism associated with each treatment. (B) The percentage change in passage time accounting for volume is plotted versus the change in volume. Rap, Tor, and CHX (1 μg/mL) are located in different quadrants compared with (A) (arrows). Vertical error bars represent the standard deviation of the mean. Horizontal error bars (density and volume) represent the standard error of the mean. All treatments induce a significant change in density (p < 0.0001, Wilcoxon rank sum). All treatments, except Torin 1 (p = 0.0501), induce a significant change in passage time (p < 0.0001, linear model). The data for the osmotic challenge are the same as those shown in Fig. 4. For the other conditions, we measured ∼200 cells and ∼1000 cells for density and deformability, respectively. To see this figure in color, go online.

References

    1. Suresh S. Biomechanics and biophysics of cancer cells. Acta Biomater. 2007;3:413–438. - PMC - PubMed
    1. Cross S.E., Jin Y.-S., Gimzewski J.K. Nanomechanical analysis of cells from cancer patients. Nat. Nanotechnol. 2007;2:780–783. - PubMed
    1. Guck J., Schinkinger S., Bilby C. Optical deformability as an inherent cell marker for testing malignant transformation and metastatic competence. Biophys. J. 2005;88:3689–3698. - PMC - PubMed
    1. Weaver W.M., Tseng P., Di Carlo D. Advances in high-throughput single-cell microtechnologies. Curr. Opin. Biotechnol. 2014;25:114–123. - PMC - PubMed
    1. Tse H.T.K., Gossett D.R., Di Carlo D. Quantitative diagnosis of malignant pleural effusions by single-cell mechanophenotyping. Sci. Transl. Med. 2013;5:212ra163. - PubMed

Publication types