. 2015 Oct 22:8:529.
doi: 10.1186/s13071-015-1144-3.

Modelling control of Schistosoma haematobium infection: predictions of the long-term impact of mass drug administration in Africa

Affiliations

Modelling control of Schistosoma haematobium infection: predictions of the long-term impact of mass drug administration in Africa

David Gurarie et al. Parasit Vectors. .

Abstract

Background: Effective control of schistosomiasis remains a challenging problem for endemic areas of the world. Given knowledge of the biology of transmission and past experience with mass drug administration (MDA) programs, it is important to critically evaluate the likelihood that MDA programs will achieve substantial reductions in Schistosoma prevalence. In implementing the World Health Organization Roadmap for Neglected Tropical Diseases it would useful for policymaking to model projections of the status of Schistosoma control in MDA-treated areas in the next 5-10 years.

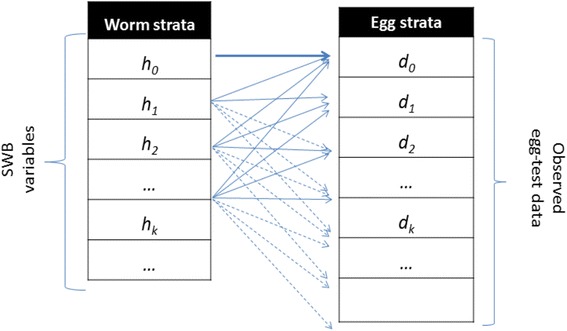
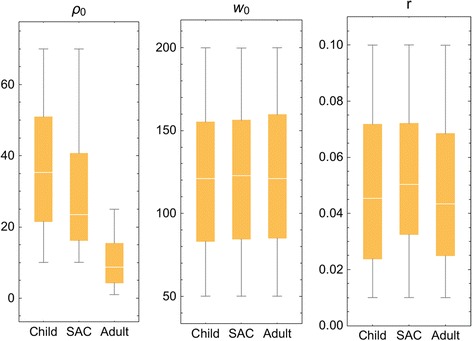
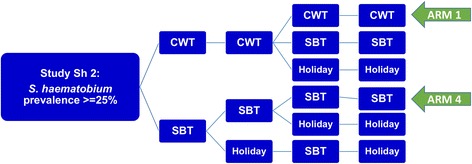
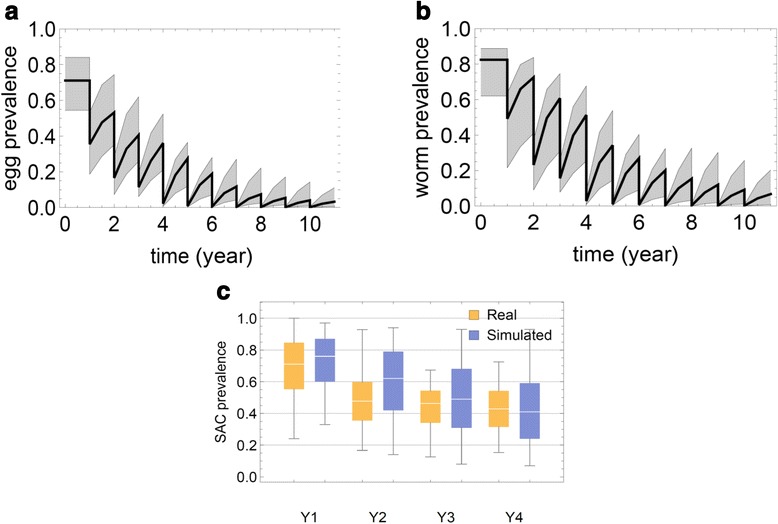
Methods: Calibrated mathematical models were used to project the effects of different frequency and coverage of MDA for schistosomiasis haematobia control in present-day endemic communities, taking into account uncertainties of parasite biology and input data. The modeling approach in this analysis was the Stratified Worm Burden model developed in our earlier works, calibrated using data from longitudinal S. haematobium control trials in Kenya.

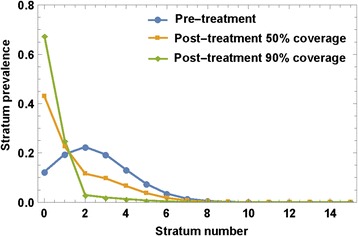
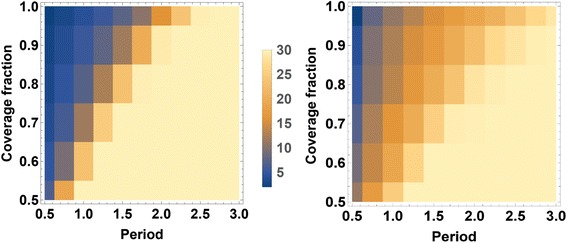
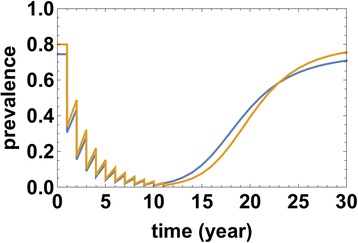
Results: Model-based simulations of MDA control in typical low-risk and higher-risk communities indicated that infection prevalence can be substantially reduced within 10 years only when there is a high degree of community participation (>70 %) with at least annual MDA. Significant risk for re-emergence of infection remains if MDA is suspended.

Conclusions: In a stable (stationary) ecosystem, Schistosoma reproduction and transmission are sufficiently robust that the process of human infection continues, even under pressure from aggressive MDA. MDA alone is unlikely to interrupt transmission, and once mass treatment is suspended, the prevalence of human infection is likely to rebound to pre-control levels over a period of 25-30 years. MDA success in achieving very low levels of infection prevalence is highly dependent on treatment coverage and frequency within the local human population, and requires that both adults and children be included in drug delivery coverage. Ultimately, supplemental snail control and significant improvements in sanitation will be required to achieve full control of schistosomiasis by elimination of ongoing Schistosoma transmission.


Figures

Fig. 1
Fig. 1
Schematic view of egg-release by SWB model population strata. Each host in h k -stratum (k = 0, 1, 2, … ) carries, on average, ϕ k mated worm couples, having fecundity factor ρ k. However, because egg-release/worm is random (in a negative binomial pattern with aggregation r k = r ϕ k), test results for the h k -stratum can actually be distributed over a broad range of egg-counts {d m}
Fig. 2
Fig. 2
Egg-prevalence as function of human force of infection (FOI). Projected egg-prevalence curves p E(λ) are shown for typical median values of child and adult parameters (ρ 0, k 0, r) obtained via our calibration approach
Fig. 3
Fig. 3
Distributed parasite biological parameters. Model parameters (ρ 0, k 0, r) estimated for 3 demographic groups (younger children, (child, 0-8 years old); mid-school age children (SAC, 9–12 years old), and adults (13+ years old) based on calibration using field data collected in the Msambweni sub-county area of coastal Kenya [32]. The individual parameters modeled are labeled at the top of each panel
Fig. 4
Fig. 4
MDA effect on SWB strata. An MDA applied to SWB population would rearrange variables {h k} by shifting higher-burden stratum h k → h ε k, depending on drug efficacy ε (worm survival rate after treatment), and treatment coverage fraction, f. The plot shows the predicted effect of different coverage fractions (f = 50 %, 90 %) on a typical SWB distribution, assuming ε = 0.75
Fig. 5
Fig. 5
SCORE control strategies trial for high risk villages. The ongoing treatment strategies trial for high Schistosoma prevalence villages in SCORE project, comparing different frequencies of CWT, SBT, and treatment holiday intervals. The analysis in this paper focuses on the most aggressive arms (Arm 1 and Arm 4) of yearly high-risk village community-wide treatment (CWT) vs. school-based treatment (SBT)
Fig. 6
Fig. 6
Egg prevalence projected in a 10 year MDA treatment simulation. Panel a shows the ensemble of estimated egg count-based prevalence values for 20 virtual communities throughout a 10 year treatment period of annual community-wide MDA. The median prevalence estimate is shown by the thick line, and the 25–75 % quantiles are indicated by the gray envelope; Panel b shows the corresponding estimates of worm-based prevalence, adjusting for the insensitivity and random components of egg counting; Panel c purple bars show the likely range of prevalence values for 9–12 year olds in 25 simulated villages in surveys performed before each of 4 yearly treatments (purple) in a SCORE-like program. Comparison to actual observed data from the SCORE Mozambique project is shown in yellow
Fig. 7
Fig. 7
Heat map of the long term program duration (mean T ) required to reach ≤ 2 % Schistosoma prevalence. Two control strategies (CWT and SBT) are compared for typical Kenyan villages. Panel (a) show T(f C, τ) map for a high-risk (80 % baseline prevalence) treated with CWT; (b) lower risk village (30 % baseline prevalence) treated with SBT. The color scale in the center indicates the number of years needed to reach local Schistosoma infection prevalence of ≤ 2 %, as determined by egg-count diagnostics. The darkest color indicates the target will be reached in 5 years or fewer, the lightest color indicates the target is not reached in 30+ years of intervention. In both cases, long term simulations take into account predicted population growth for Kenya [34]
Fig. 8
Fig. 8
Typical MDA model histories given early target reduction (T = 6 − 8 years), but with subsequent relaxation to endemic equilibrium following suspension of program intervention. The two prevalence curves correspond to egg-test (darker blue line) and worm (antigen, lighter yellow line) diagnostics

References

    1. Vos T, Flaxman AD, Naghavi M, Lozano R, Michaud C, Ezzati M, et al. Years lived with disability (YLDs) for 1160 sequelae of 289 diseases and injuries 1990-2010: a systematic analysis for the Global Burden of Disease Study 2010. Lancet. 2012;380(9859):2163–2196. doi: 10.1016/S0140-6736(12)61729-2. - DOI - PMC - PubMed
    1. Savioli L, Daumiere D. Accelerating work to overcome the global impact of Neglected Tropical Diseases: A roadmap for implementation. Geneva: World Health Organization; 2012.
    1. Colley DG, Bustinduy AL, Secor WE, King CH. Human schistosomiasis. Lancet. 2014;383:2253–2264. doi: 10.1016/S0140-6736(13)61949-2. - DOI - PMC - PubMed
    1. WHO . Preventive chemotherapy in human helminthiasis: coordinated use of anthelminthic drugs in control interventions: a manual for health professionals and programme managers. Geneva: World Health Organization; 2006.
    1. Leenstra T, Coutinho HM, Acosta LP, Langdon GC, Su L, Olveda RM, et al. Schistosoma japonicum reinfection after praziquantel treatment causes anemia associated with inflammation. Infect Immun. 2006;74(11):6398–6407. doi: 10.1128/IAI.00757-06. - DOI - PMC - PubMed

Publication types