. 2015 Oct 27;13(4):760-770.
doi: 10.1016/j.celrep.2015.09.036. Epub 2015 Oct 17.

Preventing Allograft Rejection by Targeting Immune Metabolism

Affiliations

Preventing Allograft Rejection by Targeting Immune Metabolism

Chen-Fang Lee et al. Cell Rep. .

Abstract

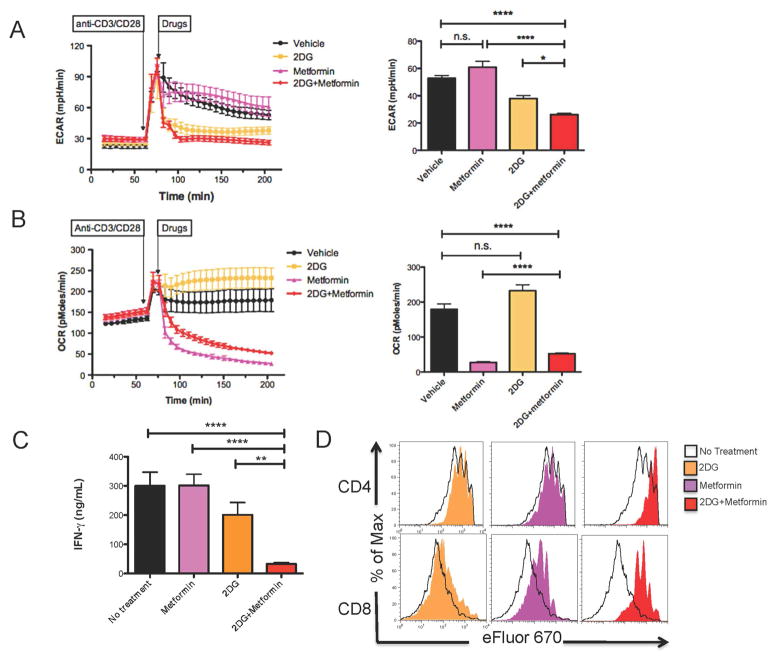
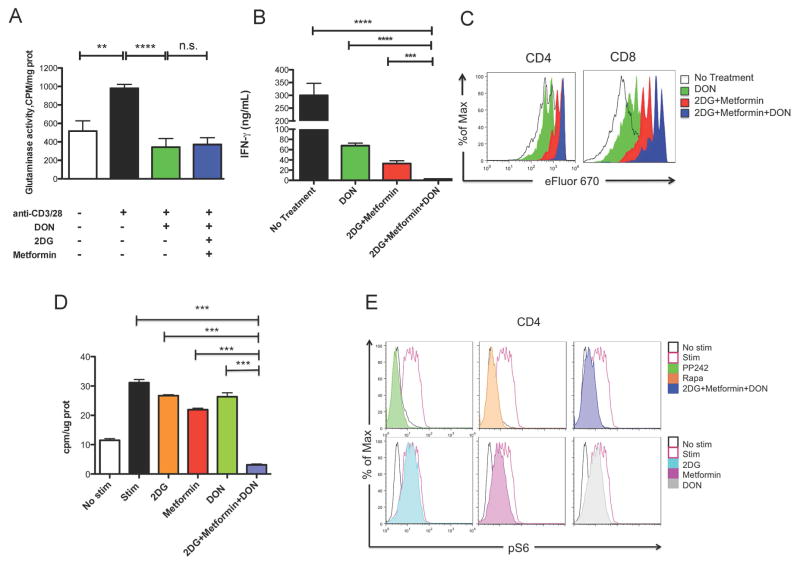
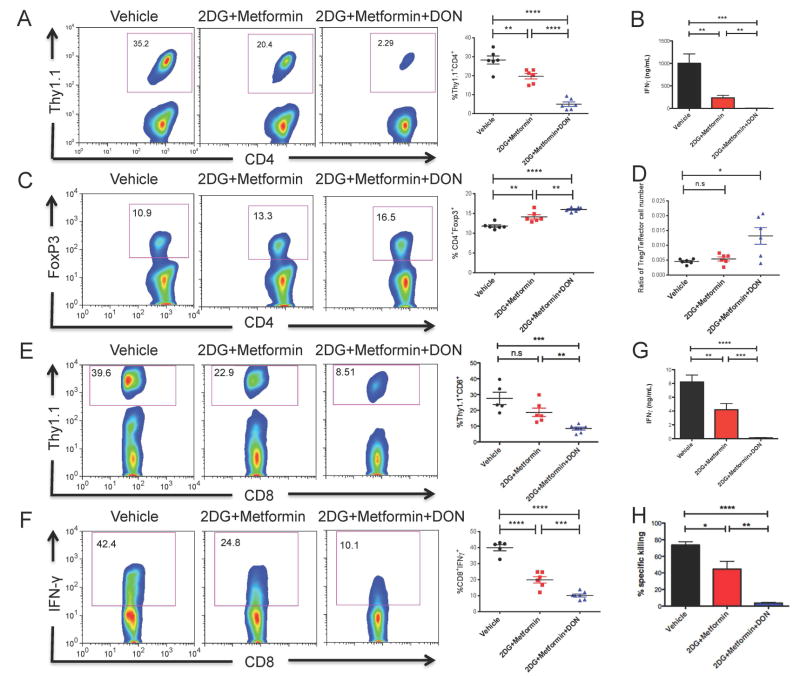
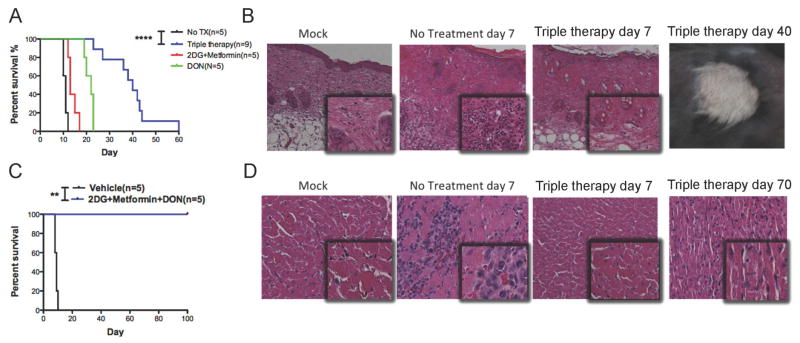
Upon antigen recognition and co-stimulation, T lymphocytes upregulate the metabolic machinery necessary to proliferate and sustain effector function. This metabolic reprogramming in T cells regulates T cell activation and differentiation but is not just a consequence of antigen recognition. Although such metabolic reprogramming promotes the differentiation and function of T effector cells, the differentiation of regulatory T cells employs different metabolic reprogramming. Therefore, we hypothesized that inhibition of glycolysis and glutamine metabolism might prevent graft rejection by inhibiting effector generation and function and promoting regulatory T cell generation. We devised an anti-rejection regimen involving the glycolytic inhibitor 2-deoxyglucose (2-DG), the anti-type II diabetes drug metformin, and the inhibitor of glutamine metabolism 6-diazo-5-oxo-L-norleucine (DON). Using this triple-drug regimen, we were able to prevent or delay graft rejection in fully mismatched skin and heart allograft transplantation models.


Figures

Figure 1
Figure 1. 2-DG combined with Metformin inhibits T cell response through suppression of glycolysis
(A and B) ECAR and OCR of resting CD4+ cells measured in real time under basal conditions and in response to anti-CD3/CD28/cross-linking IgG1 (anti-CD3, 2 μg/ml; anti-CD28, 2 μg/ml; cross-linking IgG1, 1 μg/ml) with or without the presence of individual or combination of drugs (2-DG, 10 mM; Metformin, 50 mM). Bar graphs display data of ECAR and OCR measured at the endpoint of the experiment (205 min). Data are shown as mean ± SEM of 5 measurements. (C and D) Naïve splenocytes labeled with cell proliferation dye eFluor 670 were stimulated with anti-CD3 in in the presence of media control, 2-DG alone, metformin alone or 2-DG + metformin (2-DG, 0.6mM; Metformin, 1mM). (C) 24-hour IFN-γ secretion to supernatants was interrogated by enzyme-linked immunosorbent assay (ELISA). Data are shown as mean ± SEM of three independent samples. (D) 72-hour eFluor dilution of CD4+ and CD8+ T cells. n.s., not significant, *p<0.05, **p < 0.01, ****p < 0.0001 (Student’s t test). Data are representative of at least two independent experiments.
Figure 2
Figure 2. Combined inhibition of glycolysis and glutaminolysis profoundly suppresses T cell responses
(A) Glutaminase activity of CD4+ T cells cultured for 24 hrs in different conditions (anti-CD3, 2μg/ml; anti-CD28, 2μg/ml; DON, 5 μM; 2-DG, 0.6 mM; Metformin, 1 mM). Data are shown as mean ± SEM of three independent experiments. (B and C) Naïve WT C57BL/6 splenocytes labeled with eFluor 670 and stimulated with anti-CD3 in medium containing indicated metabolic inhibitors (DON, 5μM; 2-DG, 0.6mM; Metformin, 1mM). (B) 24-hour IFN-γ secretion to supernatants as interrogated by ELISA. Data are shown as mean ± SEM of three independent samples. (C) Proliferation of CD4+ and CD8+ T cells at 72h measured by dilution of eFluor 670. n.s., not significant, **p < 0.01, ***p < 0.001, ****p < 0.0001 (Student’s t test). Data are representative of at least two independent experiments. (D) 3H-acetate incorporation into lipids in preactivated and stimulated CD4+ T cells (anti-CD3, 1μg/ml; anti-CD28, 2μg/ml; cross-linking 0.75 μg/ml) with the presence of 2DG, Metformin, DON or in combination (2DG, 5mM; Metformin, 30mM; DON, 60μM). Data are shown as mean ± SEM of three independent samples. ***p < 0.001 (ANOVA). Data are representative of two independent experiments. (E) The phosphorylation state of the S6 ribosomal protein was measured in CD4+ T cells after 30 minutes stimulation (anti-CD3, 1μg/ml; anti-CD28, 2μg/ml; cross-linking 0.75 μg/ml) with the presence of Rapamycin, PP242 and metabolic inhibitors (Rapamycin, 1μM; pp242, 1μM; 2DG, 5mM, Metformin, 30mM; DON, 60μM). Data are representative of two independent experiments.
Figure 3
Figure 3. Metabolic Inhibitors suppress the proliferation and function of antigen-specific T cells while increase the relative frequency of Tregs in vivo
(A to D) OT-II (Thy1.1+) CD4+ T cells were adoptively transferred into WT (Thy1.2+) recipient mice. The recipients were infected with OVA-expressing vaccinia virus and treated with vehicle, 2-DG+Metformin or 2-DG+metformin+DON (2-DG, 500 mg/kg once daily; metformin, 150 mg/kg once daily; DON, 1.6 mg/kg once every other day) for 3 days. Splenocytes from the recipients were harvested at day 4 to interrogate the frequency of antigen-specific T cells and regulatory T cells. (A) Percentage of Thy1.1+ cells relative to CD4+ cells were analyzed by flow cytometry (left) and plotted as cumulative data (right). (B) OT-II cells were rechallenged with OVA peptide class II (10 μg/ml) ex vivo for 24hrs. The supernatants were interrogated for IFN-γ production by ELISA. Data are mean ± SEM (n=6). (C) Percentage of Foxp3+ cells relative to CD4+ cells (left) and plotted as cumulative data (right). (D) The ratio of OVA-specific Foxp3+ T cells:Effector cells. (E to G) OT-I (Thy1.1+) CD8+ T cells were adoptively transferred into WT (Thy1.2+) recipient mice. The hosts were infected with vaccinia-OVA and treated with vehicle, 2-DG+metformin or triple therapy for 5 days. Host splenocytes were harvested at day 6 to interrogate the proliferation and function of antigen-specific CD8+ T cells. (E) Percent Thy1.1+ cells relative to CD8+ cells were analyzed by flow cytometry (left) and plotted as cumulative data (right) (F) Percent IFN-γ-producing cells relative to CD8+ cells (left) and plotted as cumulative data (right). (G) OT-I cells were rechallenged with OVA peptide class I (10μg/ml) ex vivo for 24hrs. The supernatants were interrogated for IFN-γ production by ELISA. Data are mean ± SEM (n=5 ~6) (H) The ability of metabolic inhibitors to suppress endogenous effector CD8+T cells development was assessed with in vivo CTL assay. Percent of specific killing was determined at 10 hrs after transferring target cells. Data are mean ± SEM (n=3mice/group). Each symbol represents an individual mouse. Horizontal lines indicate mean± SEM. n.s., not significant, *p < 0.05, **p < 0.01, ***p < 0.001, ****p < 0.0001 (Student’s t test). Data are representative of more than three independent experiments.
Figure 4
Figure 4. Metabolic inhibitors promote allograft survival
(A) Balb/c to C57BL/6 skin graft survival, as monitored daily by assessment of macroscopic signs of rejection. (B) Representative photomicrographs of skin graft histology (hematoxylin and eosion (H&E) staining) on post-transplant days 7 and 40 under an optical microscope (outlet, X100; inlet: X200). (C) Balb/c to C57BL/6 heart graft survival, as monitored daily by palpation of heart beating. (D) Representative photomicrographs of cardiac graft histology (H&E staining) on indicated post-transplant day under an optical microscope (outlet, X200; inlet, X400). The anti-metabolic treatment was started from the day of graft (day 0) until rejection in both models. The dosages of all drugs were the same as described in Figure 3. **p < 0.01, ****p < 0.001 (Log-rank analysis). Data are representative of two independent experiments.

References

    1. Arnold R, Pussell BA, Pianta TJ, Lin CS, Kiernan MC, Krishnan AV. Association between calcineurin inhibitor treatment and peripheral nerve dysfunction in renal transplant recipients. Am J Transplant. 2013;13:2426–2432. - PubMed
    1. Bestard O, Cassis L, Cruzado JM, Torras J, Franquesa M, Gil-Vernet S, Lucia M, Grinyo JM. Costimulatory blockade with mTor inhibition abrogates effector T-cell responses allowing regulatory T-cell survival in renal transplantation. Transpl Int. 2011;24:451–460. - PubMed
    1. Buzzai M, Jones RG, Amaravadi RK, Lum JJ, DeBerardinis RJ, Zhao F, Viollet B, Thompson CB. Systemic treatment with the antidiabetic drug metformin selectively impairs p53-deficient tumor cell growth. Cancer Res. 2007;67:6745–6752. - PubMed
    1. Carr EL, Kelman A, Wu GS, Gopaul R, Senkevitch E, Aghvanyan A, Turay AM, Frauwirth KA. Glutamine uptake and metabolism are coordinately regulated by ERK/MAPK during T lymphocyte activation. J Immunol. 2010;185:1037–1044. - PMC - PubMed
    1. Cham CM, Driessens G, O’Keefe JP, Gajewski TF. Glucose deprivation inhibits multiple key gene expression events and effector functions in CD8(+) T cells. Eur J Immunol. 2008;38:2438–2450. - PMC - PubMed

Publication types

MeSH terms