. 2015 Oct 27;13(4):733-745.
doi: 10.1016/j.celrep.2015.09.025. Epub 2015 Oct 17.

Contractile Defect Caused by Mutation in MYBPC3 Revealed under Conditions Optimized for Human PSC-Cardiomyocyte Function

Affiliations

Contractile Defect Caused by Mutation in MYBPC3 Revealed under Conditions Optimized for Human PSC-Cardiomyocyte Function

Matthew J Birket et al. Cell Rep. .

Abstract

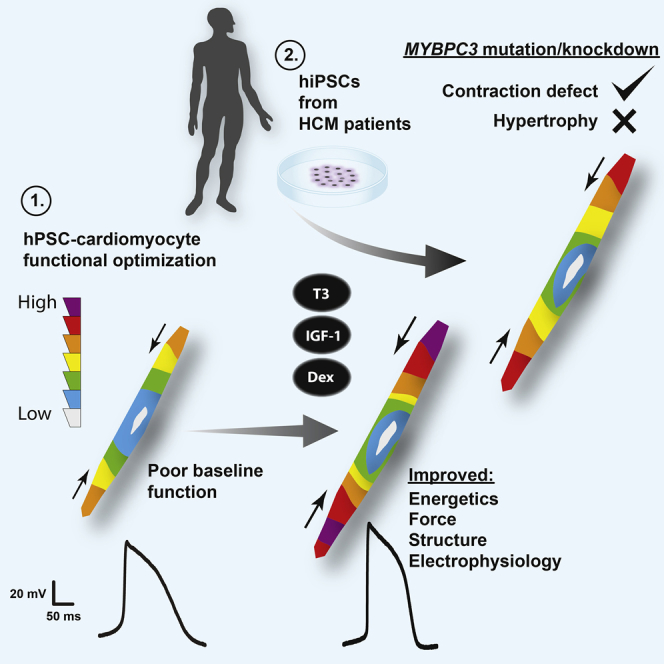
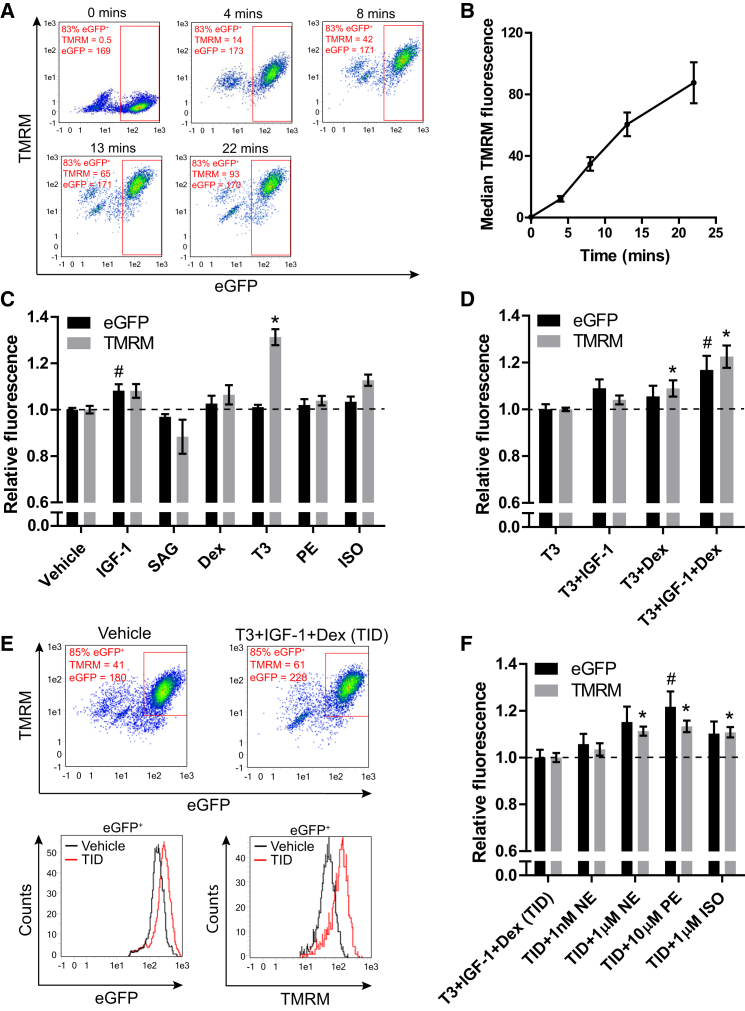
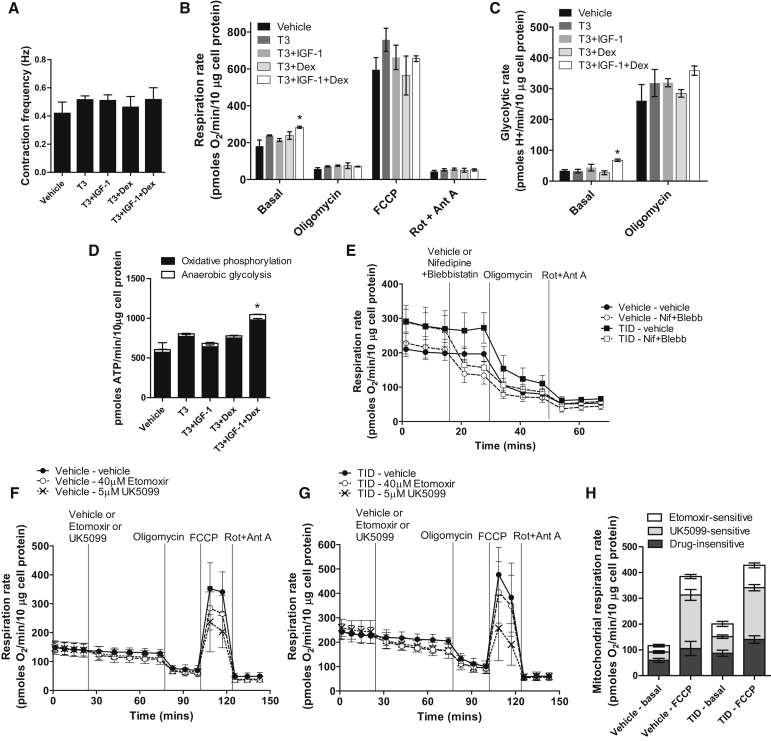
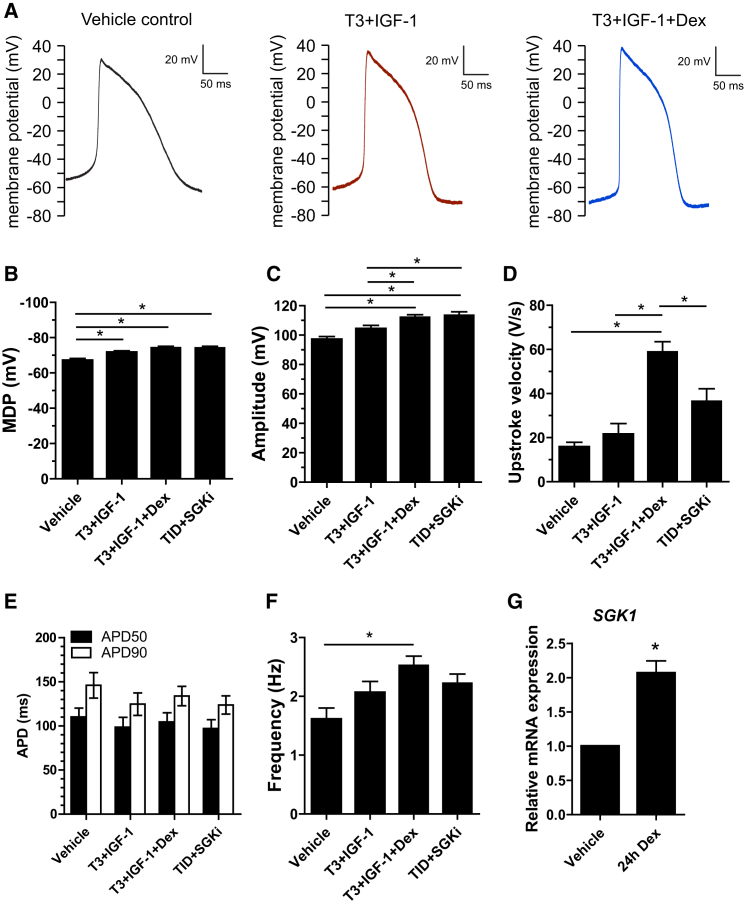
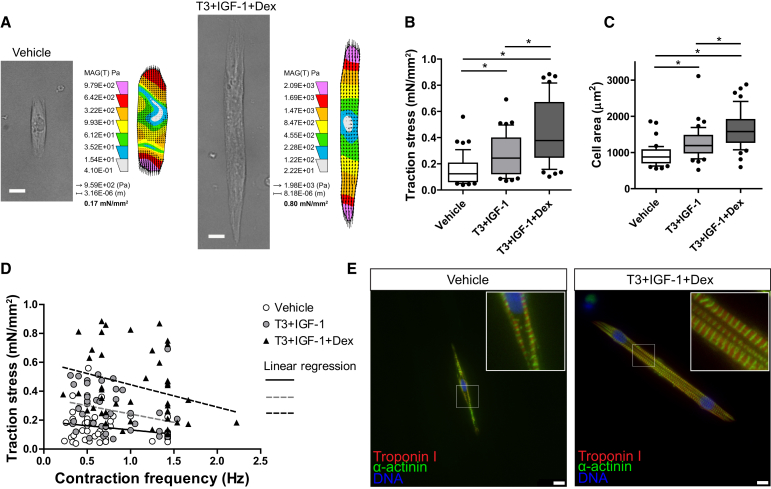
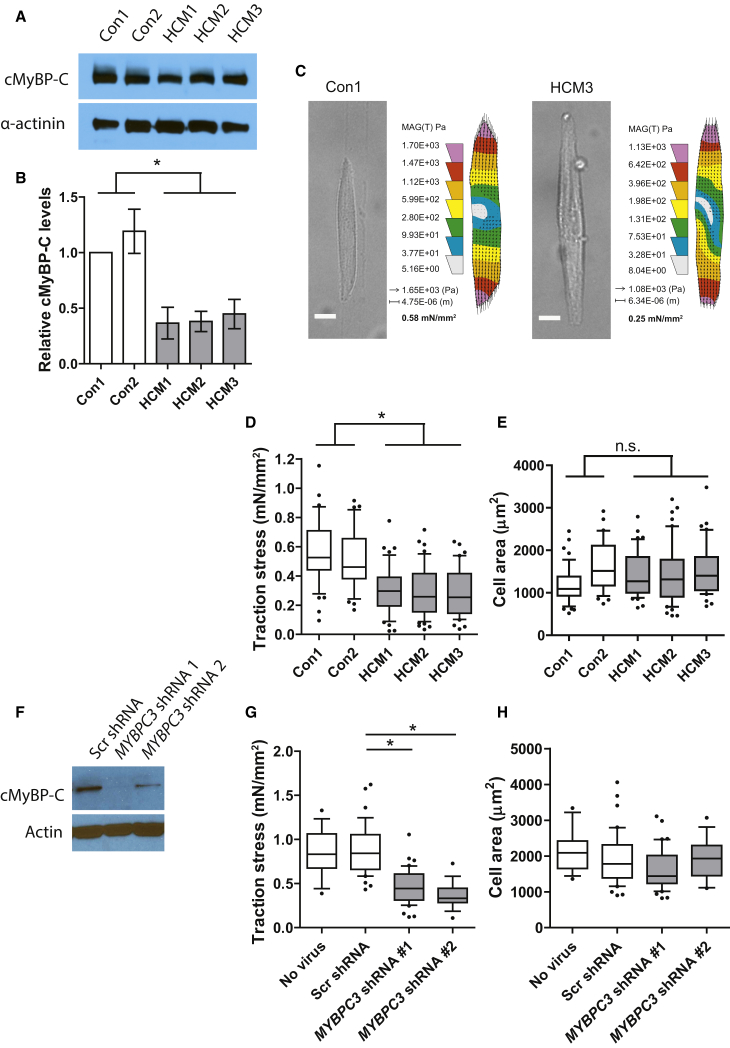
Maximizing baseline function of human pluripotent stem cell-derived cardiomyocytes (hPSC-CMs) is essential for their effective application in models of cardiac toxicity and disease. Here, we aimed to identify factors that would promote an adequate level of function to permit robust single-cell contractility measurements in a human induced pluripotent stem cell (hiPSC) model of hypertrophic cardiomyopathy (HCM). A simple screen revealed the collaborative effects of thyroid hormone, IGF-1 and the glucocorticoid analog dexamethasone on the electrophysiology, bioenergetics, and contractile force generation of hPSC-CMs. In this optimized condition, hiPSC-CMs with mutations in MYBPC3, a gene encoding myosin-binding protein C, which, when mutated, causes HCM, showed significantly lower contractile force generation than controls. This was recapitulated by direct knockdown of MYBPC3 in control hPSC-CMs, supporting a mechanism of haploinsufficiency. Modeling this disease in vitro using human cells is an important step toward identifying therapeutic interventions for HCM.


Figures

None
Graphical abstract
Figure 1
Figure 1
Using TMRM to Identify Modifiers of ΔΨp in hESC-Derived NKX2-5+ Cardiomyocytes (A) Time-course measurement of TMRM accumulation after cardiac differentiation of NKX2-5eGFP/w hESCs. fluorescence-activated cell sorting (FACS) plots show eGFP and TMRM fluorescence after 0, 4, 8, 13, and 22 min of loading with TMRM. A minor cross-bleed correction has been applied to all. (B) Median TMRM fluorescence intensity in eGFP+ cells plotted against loading time. (C) eGFP and TMRM fluorescence values in eGFP+ cardiomyocytes relative to a vehicle-only control after 5 days of incubation with the factors shown (n = 6–34). (D) eGFP and TMRM fluorescence values in eGFP+ cardiomyocytes relative to a T3-treated control after 5 days of incubation with the factors shown (n = 10–22). (E) Upper panel: example FACS plots showing measurement of a vehicle-only control alongside a T3+IGF-1+Dex-treated sample. Lower panel: histograms of eGFP and TMRM intensity in the eGFP+ populations as marked on the dot plots above. (F) eGFP and TMRM fluorescence values in eGFP+ cardiomyocytes relative to a T3+IGF-1+Dex-treated sample after 5 days of incubation with the factors shown (n = 11). Data are mean ± SEM. The n signifies biological replicates. Statistical significance compared to the vehicle-only control was calculated using a one-way ANOVA with Dunnett’s correction, #p < 0.05 for eGFP fluorescence; p < 0.05 for TMRM fluorescence. See also Figures S1 and S2.
Figure 2
Figure 2
Bioenergetic Profiling of hESC-Derived Cardiomyocytes (A) Contraction frequency in cardiomyocyte monolayers, treated for 5 days with the factors shown, prior to Seahorse measurement. (B) Respiration rates in cardiomyocyte monolayers treated with the factors shown, normalized to cell protein. Basal, endogenous rate; oligomycin, ATP synthase-inhibited rate; FCCP, maximum uncoupled rate; Rot + Ant A, non-mitochondrial respiratory rate. (C) Glycolytic rate measured in parallel with respiration, normalized to cell protein. (D) Theoretical basal ATP production rates from oxidative phosphorylation and anaerobic glycolysis calculated from measurements in (B) and (C). (E) Real-time respiration measurements of vehicle-only and TID-treated cells and response to injection of vehicle-only or nifedipine + blebbistatin, then oligomycin, and finally rotenone and antimycin A. (F and G) Real-time respiration measurements of (F) vehicle-only or (G) TID-treated cells and response to injection of vehicle-only or 40 μM etomoxir or 5 μM UK5099, then oligomycin, FCCP, and finally rotenone and antimycin A. (H) Sensitivity of basal and FCCP-stimulated mitochondrial respiration to etomoxir and UK5099 in vehicle-only or TID-treated cells. Bar data are mean ± SEM from three independent experiments, each comprising four to five measurement wells per condition. Real-time respiration plots show data of a typical experiment mean ± SD of individual wells. Statistical significance compared to the vehicle-only control was calculated using a one-way ANOVA with Dunnett’s correction for (B)–(D). p < 0.05. See also Figure S3.
Figure 3
Figure 3
Cardiomyocyte Action Potential Measurement (A) Typical examples of action potential (AP) traces from single spontaneously active cardiomyocytes maintained in the three conditions indicated. (B–G) Average data of maximum diastolic potential (MDP), AP amplitude, AP upstroke velocity, and AP duration at 50% (APD50) and 90% (APD90) repolarization and AP frequency. SGKi, 5-day co-incubation with 6 μM GSK650394. Data are mean ± SEM. Actual AP values and n values are shown in Table 1. Statistical significance was calculated using a one-way ANOVA with Tukey’s multiple comparison test p < 0.05.
Figure 4
Figure 4
Single Cardiomyocyte Traction Force Measurement (A) Typical examples of single aligned (spontaneously contracting) cardiomyocytes from vehicle-only and T3+IGF-1+Dex-containing medium, showing a bright-field image of the relaxed form and a heatmap of traction stress applied to the substrate calculated from the mean of the traction stress vectors (corresponding to Movie S1). (B–D) (B) Traction stress, (C) cell area, and (D) traction stress-frequency relationship of single spontaneously contracting cardiomyocytes maintained in vehicle (n = 44), T3+IGF-1 (n = 44), and T3+IGF-1+Dex (n = 45). (E) Immunostaining of typical aligned cardiomyocytes from vehicle- and TID-containing medium. Box and whisker plots show the median, interquartile range, and 10–90 percentile range. The n signifies the number of individual cells measured, acquired over three independent experiments. Statistical significance was calculated using a one-way ANOVA with Tukey’s multiple comparison test p < 0.05. Scale bar, 10 μm. See also Figure S4.
Figure 5
Figure 5
Single-Cell Traction Force Measurements in Cardiomyocytes with MYBPC3 Mutation or MYBPC3 shRNA Knockdown (A) Western blot of cMyBP-C protein from two control (Con1 and Con2) and three MYBPC3 mutation lines (HCM1, HCM2, and HCM3). α-actinin is shown as a loading control for cardiomyocyte input. (B) Relative cMyBP-C levels normalized to α-actinin levels based on densitometry of western blot data (n = 3–6 lysates). (C) Typical examples of single aligned (spontaneously contracting) cardiomyocytes from control (Con1) and MYBPC3 mutation (HCM3) lines, showing a bright-field image of the relaxed form and a heatmap of traction stress applied to the substrate calculated from the mean of the traction stress vectors (corresponding to Movie S2). (D and E) (D) Traction stress and (E) cell area of single spontaneously contracting iPSC-derived cardiomyocytes from two control (Con1 [n = 47] and Con2 [n = 36]) and three MYBPC3 mutation lines (HCM1 [n = 44], HCM2 [n = 54], and HCM3 [n = 43]). (F) Western blot of cMyBP-C protein in NKX2-5eGFP/w hESC-derived cardiomyocytes after transduction with a scrambled (Scr) shRNA or two independent MYBPC3-specific shRNAs. Actin is shown as a loading control. (G and H) (G) Traction stress and (H) cell area of single spontaneously contracting cardiomyocytes non-transduced (n = 15), stably expressing the Scr- (n = 32) or MYBPC3-specific (1, n = 26; 2, n = 16) shRNAs. Boxplots and whisker plots show the median, interquartile range, and 10–90 percentile range. Unless otherwise stated, the n signifies the number of individual cells measured, acquired over three independent experiments. Statistical significance was tested with a one-way ANOVA with Tukey’s multiple comparison test in (D) and (E), comparing either control against the HCM lines independently, and a Dunnett’s correction in (G) and (H). Comparison to both controls in (D) are statistically significant p < 0.05. Scale bar, 10 μm. See also Figure S5.

References

    1. Alders M., Jongbloed R., Deelen W., van den Wijngaard A., Doevendans P., Ten Cate F., Regitz-Zagrosek V., Vosberg H.P., van Langen I., Wilde A. The 2373insG mutation in the MYBPC3 gene is a founder mutation, which accounts for nearly one-fourth of the HCM cases in the Netherlands. Eur. Heart J. 2003;24:1848–1853. - PubMed
    1. Ancey C., Menet E., Corbi P., Fredj S., Garcia M., Rücker-Martin C., Bescond J., Morel F., Wijdenes J., Lecron J.-C., Potreau D. Human cardiomyocyte hypertrophy induced in vitro by gp130 stimulation. Cardiovasc. Res. 2003;59:78–85. - PubMed
    1. Barefield D., Kumar M., Gorham J., Seidman J.G., Seidman C.E., de Tombe P.P., Sadayappan S. Haploinsufficiency of MYBPC3 exacerbates the development of hypertrophic cardiomyopathy in heterozygous mice. J. Mol. Cell. Cardiol. 2015;79:234–243. - PMC - PubMed
    1. Bellin M., Casini S., Davis R.P., D’Aniello C., Haas J., Ward-van Oostwaard D., Tertoolen L.G.J., Jung C.B., Elliott D.A., Welling A. Isogenic human pluripotent stem cell pairs reveal the role of a KCNH2 mutation in long-QT syndrome. EMBO J. 2013;32:3161–3175. - PMC - PubMed
    1. Biondi B., Klein I. Hypothyroidism as a risk factor for cardiovascular disease. Endocrine. 2004;24:1–13. - PubMed

Publication types