. 2015 Dec;56(12):2337-47.
doi: 10.1194/jlr.M063354. Epub 2015 Oct 21.

ABCG1 regulates mouse adipose tissue macrophage cholesterol levels and ratio of M1 to M2 cells in obesity and caloric restriction

Affiliations

ABCG1 regulates mouse adipose tissue macrophage cholesterol levels and ratio of M1 to M2 cells in obesity and caloric restriction

Hao Wei et al. J Lipid Res. 2015 Dec.

Abstract

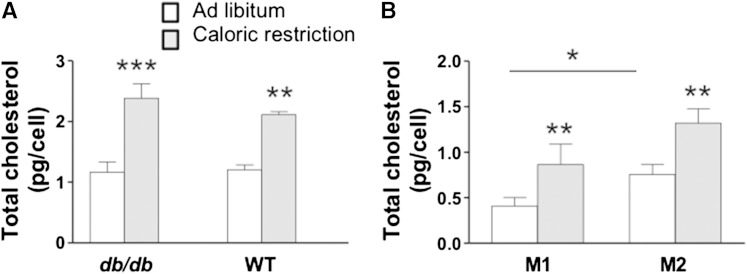
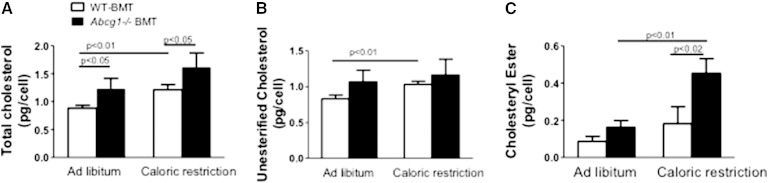
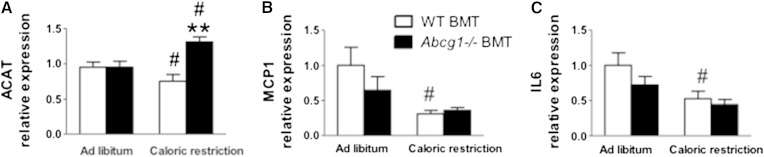
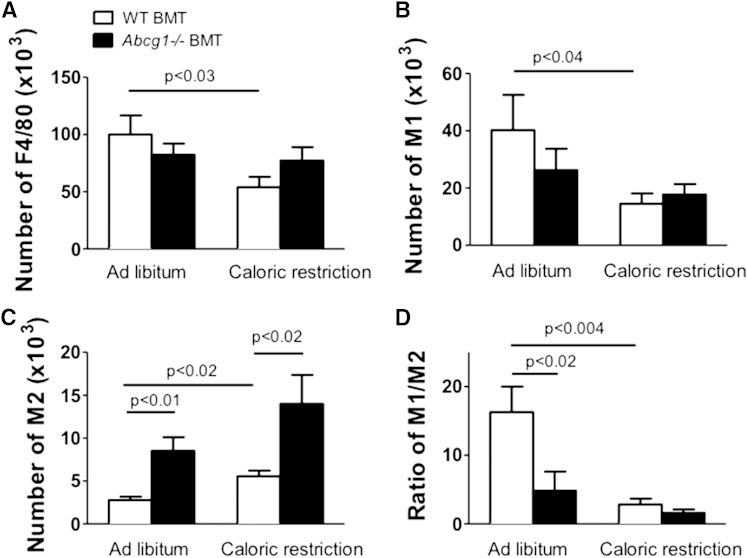
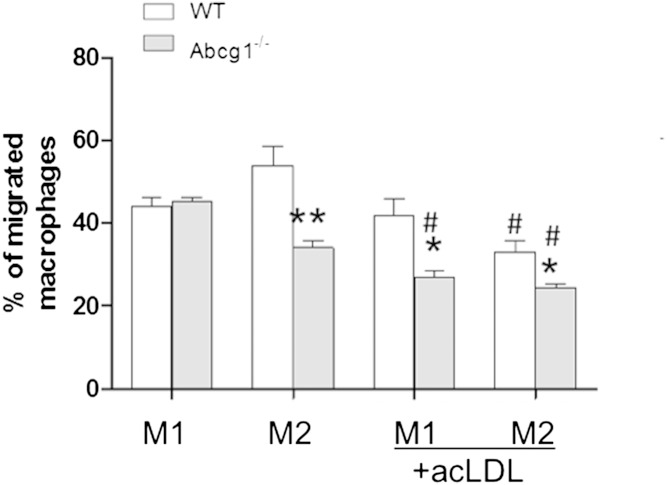
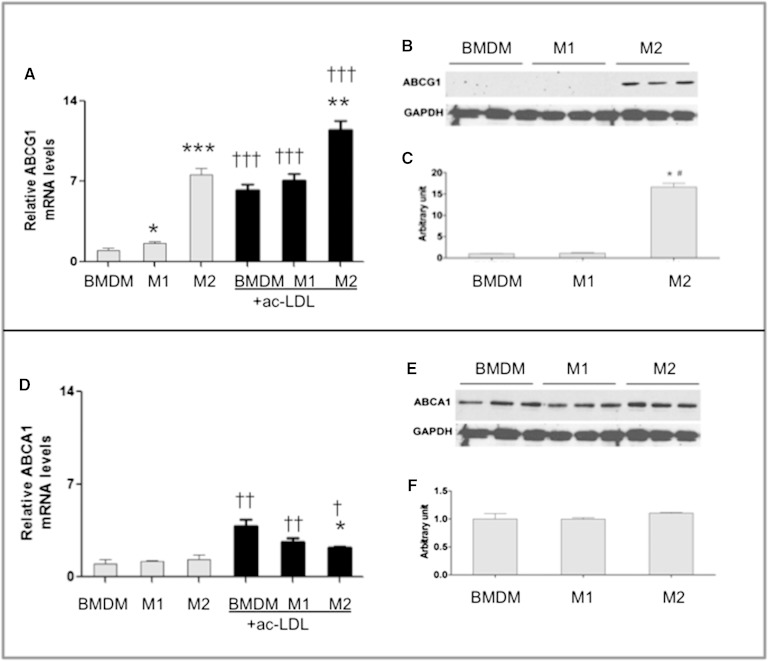
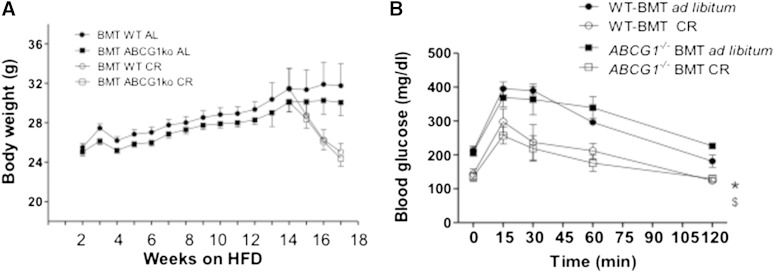
In addition to triacylglycerols, adipocytes contain a large reserve of unesterified cholesterol. During adipocyte lipolysis and cell death seen during severe obesity and weight loss, free fatty acids and cholesterol become available for uptake and processing by adipose tissue macrophages (ATMs). We hypothesize that ATMs become cholesterol enriched and participate in cholesterol clearance from adipose tissue. We previously showed that ABCG1 is robustly upregulated in ATMs taken from obese mice and further enhanced by caloric restriction. Here, we found that ATMs taken from obese and calorie-restricted mice derived from transplantation of WT or Abcg1-deficient bone marrow are cholesterol enriched. ABCG1 levels regulate the ratio of classically activated (M1) to alternatively activated (M2) ATMs and their cellular cholesterol content. Using WT and Abcg1(-/-) cultured macrophages, we found that Abcg1 is most highly expressed by M2 macrophages and that ABCG1 deficiency is sufficient to retard macrophage chemotaxis. However, changes in myeloid expression of Abcg1 did not protect mice from obesity or impaired glucose homeostasis. Overall, ABCG1 modulates ATM cholesterol content in obesity and weight loss regimes leading to an alteration in M1 to M2 ratio that we suggest is due to the extent of macrophage egress from adipose tissue.

Keywords: ATP binding cassette transporter A1; ATP binding cassette transporter G1; acyl-CoA:cholesterol acyltransferase; diabetes; fatty acid; gallstones; lipids; mice; nutrition; sterols.


Figures

Fig. 1.
Fig. 1.
Total cholesterol levels in ATMs taken from obese mice. Epididymal adipose tissue was collected from mice fed ad libitum (open bar) or subjected to caloric restriction (gray bar) (A). The db/db mice were fed rodent chow and treated as described previously (17). WT mice were fed the HFD and their treatment is described in Materials and Methods. ATMs from db/db mice were further categorized based on their surface expression of CD11C and CD206 to assess the subpopulation of M1 (CD11C+CD206) and M2 (CD11CCD206+) and isolated by FACS (B). Total cholesterol levels were quantified using LC/MS/MS. Data are presented as mean ± SEM. * P < 0.02; **P < 0.001; ***P < 0.0004 for n = 10–11 mice per strain and n = 6 ATM samples.
Fig. 2.
Fig. 2.
Deficiency in myeloid cell ABCG1 modulates ATM cholesterol levels. WT male C57BL/6 mice were irradiated and then two separate groups were engrafted with bone marrow from either WT (WT-BMT) (open bars) or Abcg1−/− (Abcg1−/− BMT) mice (black bars) (A–C). Animals were fed an HFD for 13 weeks and then subjected to 3 weeks of caloric restriction or maintained ad libitum on the HFD. ATMs were collected using FACS as described in Materials and Methods. Total (A), unesterified (B), and esterified (C) cholesterol levels were quantified using LC/MS/MS. Values are presented as mean ± SEM (n = 5), and P values are shown in the figure.
Fig. 3.
Fig. 3.
mRNA levels for cholesterol metabolism and inflammatory genes in epididymal tissues taken from mice. WT-BMT (open bars) and Abcg1−/− BMT (black bars) were treated as described in Figure 2. mRNA was isolated and PCR performed as described in Materials and Methods. mRNA results are expressed as fold induction as compared with WT-BMT (WT-BMT = 1 arbitrary unit). Values are presented for ACAT (A), MCP1 (B), and IL-6 (C). Data are expressed as mean ± SEM for n = 8 mice. ** P < 0.03 between WT-BMT and Abcg1−/− BMT. # P < 0.003 between ad libitum and caloric restriction treatments within the same mouse strain.
Fig. 4.
Fig. 4.
Loss of Abcg1 expression increases the numbers of M2 but not M1 ATMs. WT-BMT and Abcg1−/− BMT were generated and treated as described in Figure 2. ATMs were collected using FACS as described in Materials and Methods. Values are given for numbers of total F4/80+ cells (A), M1 ATMs (B), M2 ATMs (C), and the ratio of M1 to M2 cells (D) for mice in ad libitum and caloric restriction groups. Data are presented as mean ± SEM (n = 4–5). P values are show in the figure.
Fig. 5.
Fig. 5.
Deletion of ABCG1 is sufficient to impair macrophage migration. Bone marrow cells from C57BL/6 (WT) and Abcg1−/− mice were differentiated into BMDMs and further polarized into M1 and M2 macrophages as described in Materials and Methods. The migration capability of M1 and M2 macrophages from different genotypes was assessed using a microplate chemotaxis system as described in Materials and Methods. Migration capability of cells derived from WT (white bars) and Abcg1−/− (gray bars) bone marrow cells was expressed as percentage of migrated cells to total cells. Values are presented as mean ± SEM (n = 3). * P < 0.05 between WT and Abcg1−/− cells; ** P < 0.01 between WT and Abcg1−/− cells; # P < 0.05 between M1 and M2 macrophages within the same genotype. In both cases, n = 3; experiments were done using three separate mice per genotype.
Fig. 6.
Fig. 6.
Abcg1 but not Abca1 is preferentially expressed by M2 macrophages. BMDMs and M1 and M2 macrophages were cultured from WT (C57BL/6 male) bone marrow cells as described in Materials and Methods. mRNA and protein levels were evaluated for Abcg1 (A–C) and Abca1 (D–F) for cells without cholesterol loading. Additional cells were incubated with ac-LDL for 24 h and then quantified for Abcg1 (A, black bars) and Abca1 (D, black bars) expression. mRNA levels were quantified by RT-PCR and normalized to L32 levels. Protein was isolated from cell lysates and prepared for SDS-PAGE and immunoblotting using GAPDH as a protein loading control as in Materials and Methods. Signal bands were quantified by densitometry using National Institutes of Health ImageJ software for protein levels. Values are presented as mean ± SEM (n = 3–4). * P < 0.05, ** P < 0.01, *** P < 0.001 between BMDM and M1 or M2 groups within noncholesterol and cholesterol-loaded groups (n = 3); † P < 0.05, †† P < 0.01, ††† P < 0.001 between noncholesterol and cholesterol-loaded cells within BMDM, M1, and M2 cell types (n = 4).
Fig. 7.
Fig. 7.
Body weights and glucose status for mice that are WT or deficient in Abcg1 expression. Animals were fed an HFD for 13 weeks and then subjected to 3 weeks of caloric restriction (CR) or maintained ad libitum on the HFD. Mouse groups are as described in Figure 2. Mice were monitored for body weight weekly. (A) No significant differences were seen between WT-BMT and Abcg1−/− BMT mice during either the ad libitum or CR arms of this study. Data are presented as means ± SEM; n = 39–40 for weeks 1–12; n = 9–10 for weeks 13–16. IPGTTs were performed at several time points as described in Materials and Methods. (B) Shown are final values for BMT mice including WT mice transplanted with WT bone marrow in the ad libitum (black circle) and CR (open circle) treatment groups, and Abcg1−/− BMT ad libitum (black square) and CR (open square) groups. Symbols shown are P < 0.05 between ad libitum and CR responses at 120 min. No significant differences in glucose homeostasis was seen between mouse strains within each diet treatment group for n = 5 mice per strain.

References

    1. Azagury D. E., and Lautz D. B.. 2011. Obesity overview: epidemiology, health and financial impact, and guidelines for qualification for surgical therapy. Gastrointest. Endosc. Clin. N. Am. 21: 189–201. - PubMed
    1. Banim P. J., Luben R. N., Bulluck H., Sharp S. J., Wareham N. J., Khaw K. T., and Hart A. R.. 2011. The aetiology of symptomatic gallstones quantification of the effects of obesity, alcohol and serum lipids on risk. Epidemiological and biomarker data from a UK prospective cohort study (EPIC-Norfolk). Eur. J. Gastroenterol. Hepatol. 23: 733–740. - PubMed
    1. Malik V. S., Willett W. C., and Hu F. B.. 2013. Global obesity: trends, risk factors and policy implications. Nat. Rev. Endocrinol. 9: 13–27. - PubMed
    1. World Health Organization. 2009. Global Health Risks: Mortality and Burden of Disease Attributable to Selected Major Risks. World Health Organization, Geneva.
    1. Blecker S., Herbert R., and Brancati F. L.. 2012. Comorbid diabetes and end-of-life expenditures among Medicare beneficiaries with heart failure. J. Card. Fail. 18: 41–46. - PMC - PubMed

Publication types

Substances