. 2015 Nov 10;5(5):728-740.
doi: 10.1016/j.stemcr.2015.09.009. Epub 2015 Oct 17.

Progressive Chromatin Condensation and H3K9 Methylation Regulate the Differentiation of Embryonic and Hematopoietic Stem Cells

Affiliations

Progressive Chromatin Condensation and H3K9 Methylation Regulate the Differentiation of Embryonic and Hematopoietic Stem Cells

Fernando Ugarte et al. Stem Cell Reports. .

Abstract

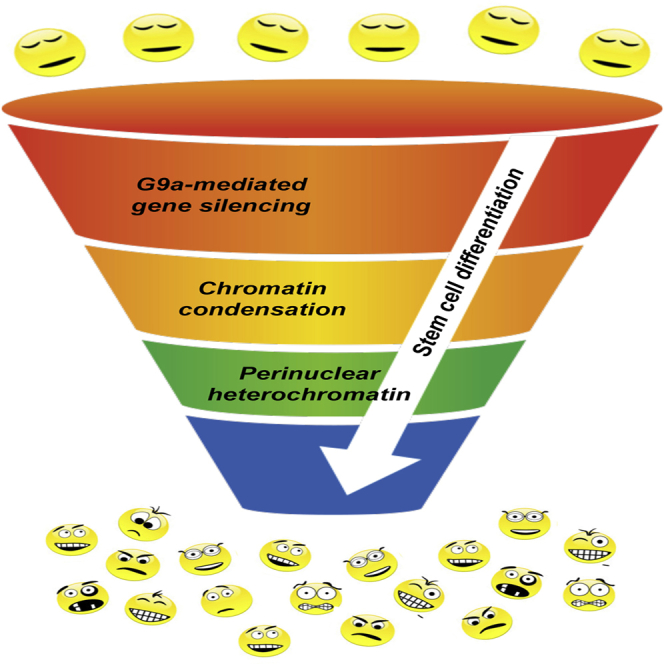
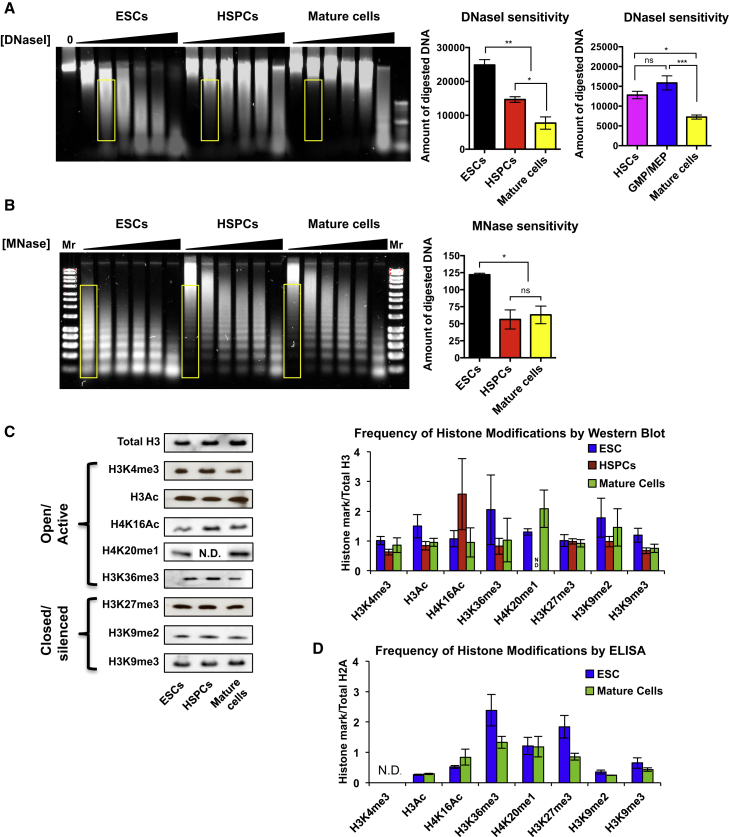
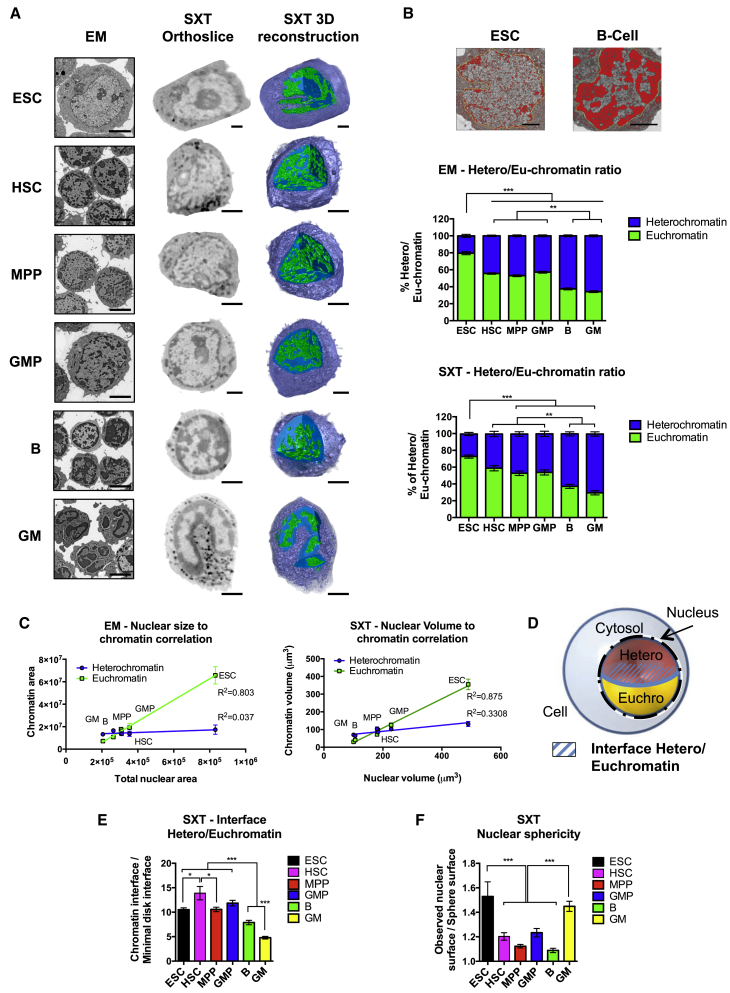
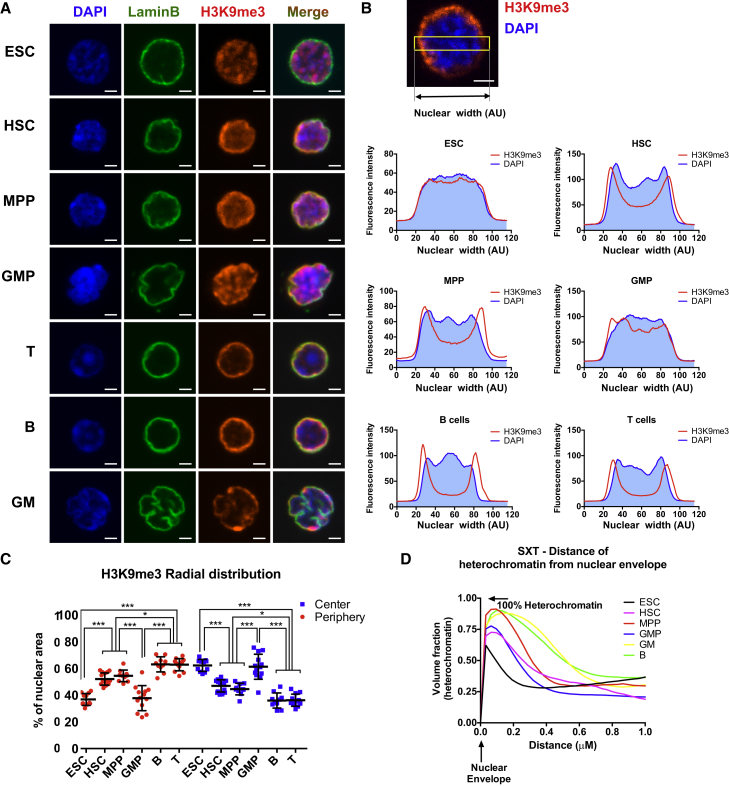
Epigenetic regulation serves as the basis for stem cell differentiation into distinct cell types, but it is unclear how global epigenetic changes are regulated during this process. Here, we tested the hypothesis that global chromatin organization affects the lineage potential of stem cells and that manipulation of chromatin dynamics influences stem cell function. Using nuclease sensitivity assays, we found a progressive decrease in chromatin digestion among pluripotent embryonic stem cells (ESCs), multipotent hematopoietic stem cells (HSCs), and mature hematopoietic cells. Quantitative high-resolution microscopy revealed that ESCs contain significantly more euchromatin than HSCs, with a further reduction in mature cells. Increased cellular maturation also led to heterochromatin localization to the nuclear periphery. Functionally, prevention of heterochromatin formation by inhibition of the histone methyltransferase G9A resulted in delayed HSC differentiation. Our results demonstrate global chromatin rearrangements during stem cell differentiation and that heterochromatin formation by H3K9 methylation regulates HSC differentiation.


Figures

None
Graphical abstract
Figure 1
Figure 1
Progressive Decrease in Nuclease Sensitivity upon Stem Cell Differentiation (A) Multipotent HSPCs display greater sensitivity to DNaseI digestion than mature hematopoietic cells but lower sensitivity compared to pluripotent ESCs. Each cell population was incubated with increasing concentrations of DNaseI, followed by DNA separation by gel electrophoresis (left panels). No significant differences were detected between HSCs and GMPs/MEPs. DNaseI sensitivity was quantified (middle and right panels) as the amount of digested DNA at equal concentrations of DNaseI (yellow rectangles in left panel). n = 6 independent experiments. Statistics by one-way ANOVA. (B) MNase sensitivity assays revealed higher ESC sensitivity to MNase digestion, but no differences between HSPCs and mature hematopoietic cells, indicating that nucleosome linker regions are differentially organized in ESCs compared to multipotent and mature hematopoietic cells. n = 3 independent experiments. Statistics by one-way ANOVA. (C and D) The global abundance of histone modifications does not change significantly among ESCs, HSPCs, and mature cells. Each modification was measured using semiquantitative immunoblot analysis (C) or nucleosome ELISA (D). n = 8 and statistics by two-way ANOVA (C), and n = 3–4 and statistics by t test (D). Data are means ± SEM; p < 0.05, ∗∗p < 0.01, and ∗∗∗p < 0.001; ns, not significant; N.D., not determined. See also Figure S1.
Figure 2
Figure 2
Alterations in Nuclear Architecture and Chromatin Conformation upon Stem Cell Differentiation (A) High-resolution imaging of ESCs, HSCs, MPPs, GMPs, B cells, and GM cells by electron microscopy (left column) and soft X-ray tomography (middle and right columns) displays the organization of hetero- (dark or blue nuclear regions) and euchromatin (light or green nuclear regions) in a single plane (left and middle) as well as in a 3D reconstruction (right). (B) Quantification of the ratios of heterochromatin and euchromatin area by EM and volume by SXT revealed significant reductions in the proportion of euchromatin upon stem cell differentiation. The top image depicts examples of EM-based quantification of densely appearing heterochromatin, illustrating the stark differences between heterochromatin staining between ESCs and B cells. (EM, n = 30 cells; SXT, n = 8 cells; per cell type in three or more experiments.) (C) Positive correlation of the amount of euchromatin and nuclear size by EM (top) and SXT (bottom) analyses. (EM, n = 30 cells; SXT, n = 8 cells; per cell type in three or more experiments.) (D) Theoretical model of a cell nucleus as a perfect sphere and the interphase between hetero- and euchromatin as a perfect disk. (E) Quantification of the total area of the euchromatin/heterochromatin interface by SXT revealed that stem and progenitor cells have significantly larger euchromatin/heterochromatin interaction areas than lineage-committed cells. All cell types deviate from the theoretical interphase of a perfect disk, designated as 1. (EM, n = 30 cells; SXT, n = 8 cells; per cell type in three or more experiments.) (F) ESCs and mature GM cells have the highest degree of nuclear folding, quantified as nuclear sphericity, while HSPCs and B cells are the closest to a theoretical perfect sphere (= 1). (EM, n = 30 cells; SXT, n = 8 cells; per cell type in three or more experiments.) Data are means ± SEM; p < 0.05, ∗∗p < 0.01, and ∗∗∗p < 0.001; ns, not significant. Statistics by one-way ANOVA. Scale bars represent 4 uM for EM images in (A); all other scale bars are 2 uM. See also Figure S2 and Movies S1, S2, and S3.
Figure 3
Figure 3
Subnuclear Distribution of Heterochromatin Is Altered upon Stem Cell Differentiation (A) Immunohistochemistry for H3K9me3 revealed differential heterochromatin distribution in the nuclei of different cell types, gradually shifting from a dispersed distribution in ESCs to a tight, pericentric distribution in mature cells. Lamin B was used to mark the nuclear envelope. (B) Average radial distribution of H3K9me3 (red line) across the width of the nucleus (indicated with a yellow box, top) superimposed on DAPI stain (blue histogram) in the cell types displayed in (A). GMPs showed a less defined pattern, with significant foci in the center of the nucleus, similar to ESCs. The distinct shape of the nuclear membrane of mature GM cells (bottom row in A) precluded comparative quantification. n = 12 cells per cell type in three independent experiments. (C) Quantification of the H3K9me3 distribution across the center (inner 60%) and periphery (outer 20% of each edge) of the nuclei of different cell types demonstrated a progressive shift in H3K9me3 localization from the nuclear center to the periphery during stem cell differentiation. As in (A) and (B), GMPs represent an exception to this pattern. (D) Analysis of the fraction of heterochromatin, measured by SXT as heterochromatin volume, at increasing distance from the nuclear envelope shows the accumulation of heterochromatin at the nuclear periphery in more differentiated cells. Mature GM and B cells (yellow and green lines) have a thicker ring of heterochromatin close to the nuclear envelope, whereas ESCs (black line) have a very thin ring of heterochromatin near the nuclear envelope. Data are means ± SEM; p < 0.05, ∗∗p < 0.01, and ∗∗∗p < 0.001; ns, not significant. Statistics by one-way ANOVA. Scale bars, 2 um. See also Figure S3.
Figure 4
Figure 4
G9A Inhibition Uniquely Leads to Hematopoietic Progenitor Accumulation In Vitro Numbers of live cells and KLS cells after 5 days of in vitro liquid culture of mouse HSCs (isolated as KLS Flk2-CD150+ BM cells) with the G9A inhibitor UNC0638 at varying concentrations. The number of KLS cells significantly increased at 0.1–1 uM of UNC0638 in comparison to the DMSO-treated controls. The number of total live cells started to significantly decline at 1 uM of UNC0638. Data shown are calculated from n = 4 wells in two independent experiments with HSCs grown in liquid culture. Similar results were obtained when HSCs were grown on AFT024 stromal cells (data not shown). On the basis of these data, we used UNC0638 at 0.3 uM for subsequent experiments. Statistical analyses for cell viability (open bars) and KLS cell accumulation (black bars) relative to the vehicle control conditions were determined using two-way ANOVA of three or more independent experiments. p ≤ 0.05, ∗∗p ≤ 0.01, and ∗∗∗p ≤ 0.001.
Figure 5
Figure 5
G9A Inhibition Impairs HSC Differentiation In Vitro (A) G9A inhibition via the inhibitor UNC0638 led to a significant increase in the frequency (flow cytometry plots; 66.8% versus 21.9%) and number (right bar graph) of KLS cells compared to the DMSO control. HSCs (isolated as KLS Flk2CD150+ BM cells) were cultured for 5 days in vitro with or without UNC0638. n = 3 independent experiments. (B) Cell-cycle analysis using EdU incorporation combined with Hoechst staining revealed that a higher percentage of UNC0638-treated KLS cells were in S phase compared to the DMSO-treated controls (56% versus 44%), demonstrating increased proliferation in UNC0638-treated cells. Myeloid progenitor cells harvested from the same wells displayed no differences in cell-cycle status. n = 3 independent experiments. (C) Hematopoietic reconstitution was not improved by UNC0638 treatment of HSCs. Purified HSCs were cultured in the presence or absence of UNC0638 as in (A). After 24 hr of culture, KLS cells were sorted from each condition, and equal numbers (500 per mouse) were transplanted into lethally irradiated recipients. Erythrocytes, platelets, GM, B cells, and T cells were detected from both conditions, with no significant differences in reconstitution levels or lineage distribution. Line graphs display the peripheral blood reconstitution of each lineage over time for one out of three independent experiments, each performed with at least three recipient mice. Bar graphs display the short-term (left graph; measured at 2–6 weeks post-transplantation depending on cell type) or long-term (right graph; measured > 14 weeks post-transplantation for all cell types) reconstitution for each lineage for all three experiments. n = 3 independent experiments with 8–10 recipient mice per group. p values were determined using two-way ANOVA. No significant differences were observed. (D) Gene expression analysis by RNA-seq (left) revealed a significant number of upregulated HSC-related genes in UNC0638-treated cells compared to control cells grown without inhibitor (DESEQ padj < 0.01). The differential expression of a subset of these genes was verified by qRT-PCR (middle panel). The overlap (138 genes) of genes upregulated upon UNC0638 treatment of HSCs (650 genes) that also have higher expression in freshly isolated HSCs compared to MPPs (635 genes) is highly significant (right panel), indicating that UNC0638 promotes a more HSC-like expression. The intersect of differentially regulated genes was assessed by php coding, and the p value calculated by hypergeometric test (http://nemates.org/MA/progs/overlap_stats.html). n = 3 independent experiments. (E) ChIP-qPCR demonstrated significantly reduced levels of H3K9me2 on promoters of putative G9A targets based on RNA-seq. A trend toward H3K9me3 reduction was also observed, but no differences were found for the active mark H3K4me3. n = 3 independent experiments. (F) Gene set enrichment analysis (GSEA) of RNA-seq data from (D) revealed that G-protein-coupled receptors is the most significantly differentially expressed gene category between control and UNC0638-treated HSCs. (G) Transwell migration assay demonstrated an impaired capacity of UNC0638 KLS cells to migrate toward the chemokine SDF1. n = 3 independent experiments. Data are means ± SEM; p < 0.05, ∗∗p < 0.01, and ∗∗∗p < 0.001; ns, not significant. Statistical analysis by two-tailed t test. See also Figures S4 and S5.

References

    1. Alabert C., Groth A. Chromatin replication and epigenome maintenance. Nat. Rev. Mol. Cell Biol. 2012;13:153–167. - PubMed
    1. Asai T., Liu Y., Di Giandomenico S., Bae N., Ndiaye-Lobry D., Deblasio A., Menendez S., Antipin Y., Reva B., Wevrick R., Nimer S.D. Necdin, a p53 target gene, regulates the quiescence and response to genotoxic stress of hematopoietic stem/progenitor cells. Blood. 2012;120:1601–1612. - PMC - PubMed
    1. Azuara V., Perry P., Sauer S., Spivakov M., Jørgensen H.F., John R.M., Gouti M., Casanova M., Warnes G., Merkenschlager M., Fisher A.G. Chromatin signatures of pluripotent cell lines. Nat. Cell Biol. 2006;8:532–538. - PubMed
    1. Barski A., Cuddapah S., Cui K., Roh T.-Y., Schones D.E., Wang Z., Wei G., Chepelev I., Zhao K. High-resolution profiling of histone methylations in the human genome. Cell. 2007;129:823–837. - PubMed
    1. Beaudin A.E., Boyer S.W., Forsberg E.C. Flk2/Flt3 promotes both myeloid and lymphoid development by expanding non-self-renewing multipotent hematopoietic progenitor cells. Exp. Hematol. 2014;42:218–229. - PMC - PubMed

Publication types

MeSH terms