

Quantifying the prevalence of frailty in English hospitals
- PMID: 26490097
- PMCID: PMC4621378
- DOI: 10.1136/bmjopen-2015-008456
Quantifying the prevalence of frailty in English hospitals
Erratum in
-
Correction.BMJ Open. 2015 Nov 19;5(11):e008456. doi: 10.1136/bmjopen-2015-008456corr1. BMJ Open. 2015. PMID: 26586320 Free PMC article. No abstract available.
Abstract
Objectives: Population ageing has been associated with an increase in comorbid chronic disease, functional dependence, disability and associated higher health care costs. Frailty Syndromes have been proposed as a way to define this group within older persons. We explore whether frailty syndromes are a reliable methodology to quantify clinically significant frailty within hospital settings, and measure trends and geospatial variation using English secondary care data set Hospital Episode Statistics (HES).
Setting: National English Secondary Care Administrative Data HES.
Participants: All 50,540,141 patient spells for patients over 65 years admitted to acute provider hospitals in England (January 2005-March 2013) within HES.
Primary and secondary outcome measures: We explore the prevalence of Frailty Syndromes as coded by International Statistical Classification of Diseases, Injuries and Causes of Death (ICD-10) over time, and their geographic distribution across England. We examine national trends for admission spells, inpatient mortality and 30-day readmission.
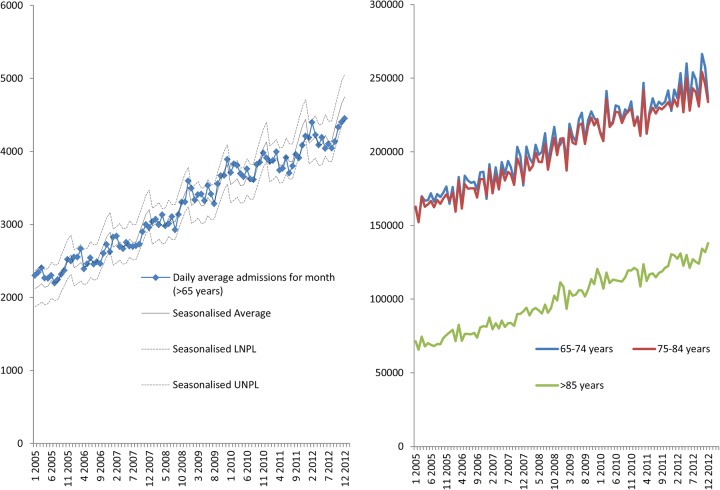
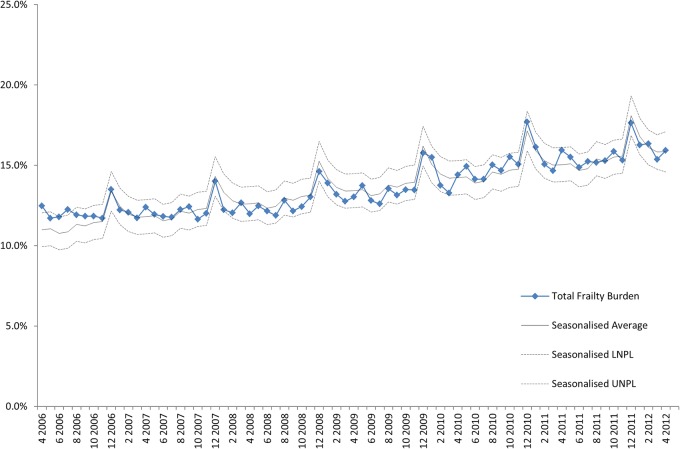
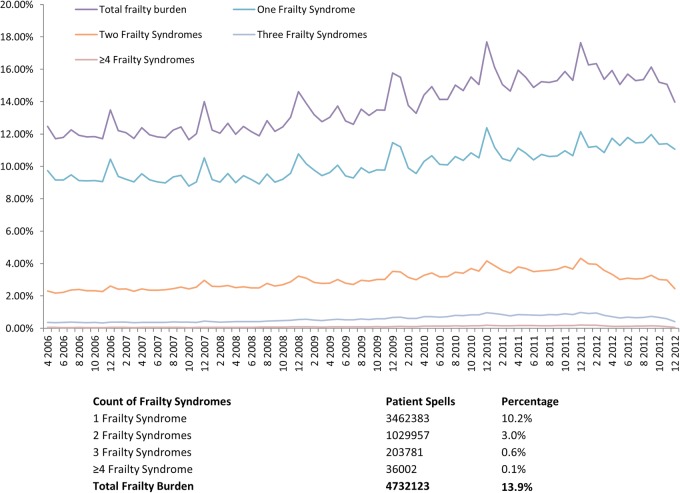
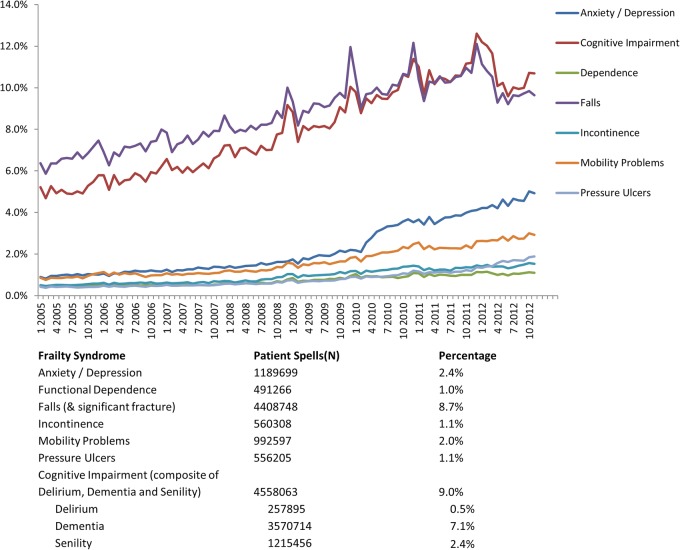
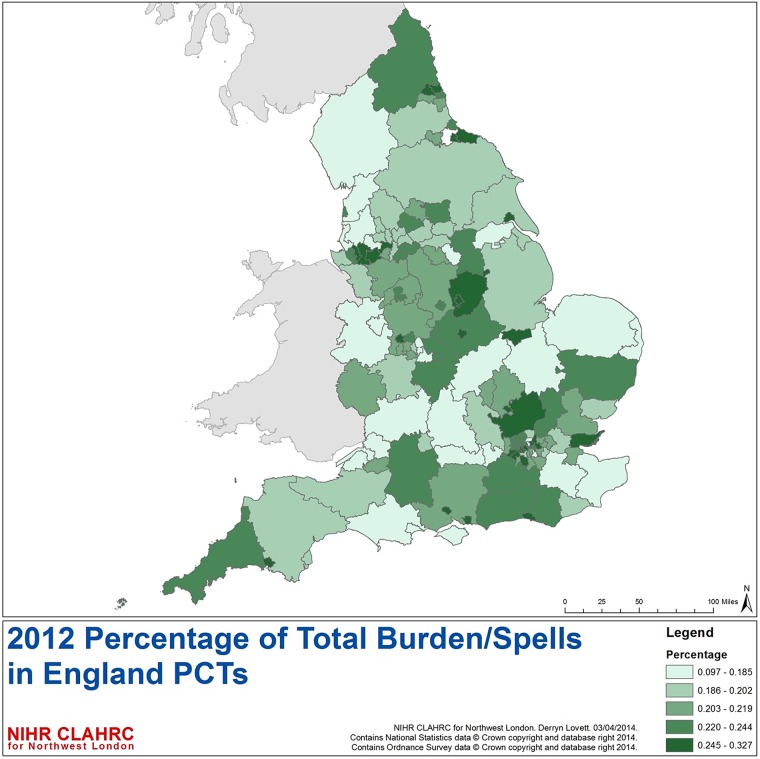
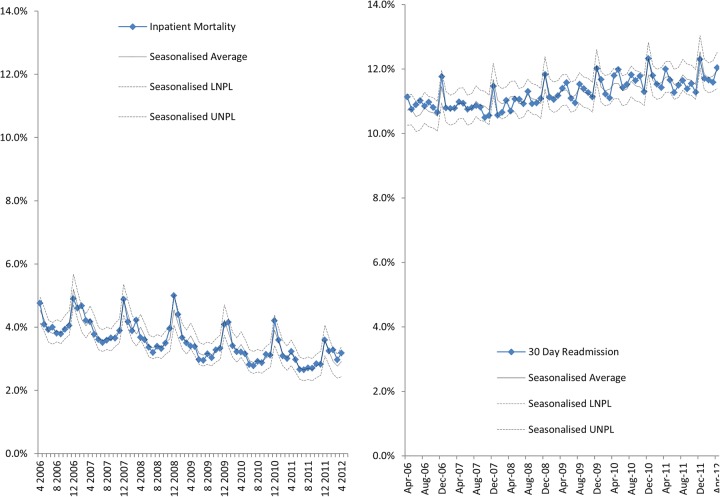
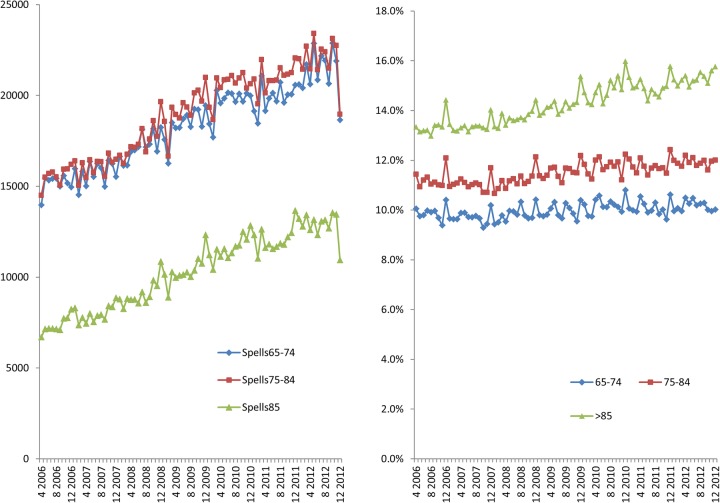
Results: A rising trend of admission spells was noted from January 2005 to March 2013 (daily average admissions for month rising from over 2000 to over 4000). The overall prevalence of coded frailty is increasing (64,559 spells in January 2005 to 150,085 spells by Jan 2013). The majority of patients had a single frailty syndrome coded (10.2% vs total burden of 13.9%). Cognitive impairment and falls (including significant fracture) are the most common frailty syndromes coded within HES. Geographic variation in frailty burden was in keeping with known distribution of prevalence of the English elderly population and location of National Health Service (NHS) acute provider sites. Overtime, in-hospital mortality has decreased (>65 years) whereas readmission rates have increased (esp.>85 years).
Conclusions: This study provides a novel methodology to reliably quantify clinically significant frailty. Applications include evaluation of health service improvement over time, risk stratification and optimisation of services.
Keywords: Acute; Ageing; England; Frailty; HES; Prevalence.
Published by the BMJ Publishing Group Limited. For permission to use (where not already granted under a licence) please go to http://group.bmj.com/group/rights-licensing/permissions.
Figures
References
-
- United Nations Department of Economics and Social Affairs. Demographic Yearbook 64th issue. 2013;64:1–912.
-
- Cornwell J. The Care of Frail Older People with Complex Needs: Time for a revolution. The Sir Roger Bannister Health Summit, LeedsCastle: The King's Fund, 2012.
-
- Department of Health. Improving care and saving money: learning the lessons on prevention and early intervention for older people. 2010.
-
- Blunt I, Bardsley M, Dixon J. Trends in emergency admissions in England 2004–2009: is greater efficiency breeding inefficiency. London: The Nuffield Trust, 2010.
MeSH terms
LinkOut - more resources
Full Text Sources
Other Literature Sources
Medical