. 2015 Dec;21(12):2119-31.
doi: 10.1261/rna.053397.115. Epub 2015 Oct 21.

Modeling of autosomal-dominant retinitis pigmentosa in Caenorhabditis elegans uncovers a nexus between global impaired functioning of certain splicing factors and cell type-specific apoptosis

Affiliations

Modeling of autosomal-dominant retinitis pigmentosa in Caenorhabditis elegans uncovers a nexus between global impaired functioning of certain splicing factors and cell type-specific apoptosis

Karinna Rubio-Peña et al. RNA. 2015 Dec.

Abstract

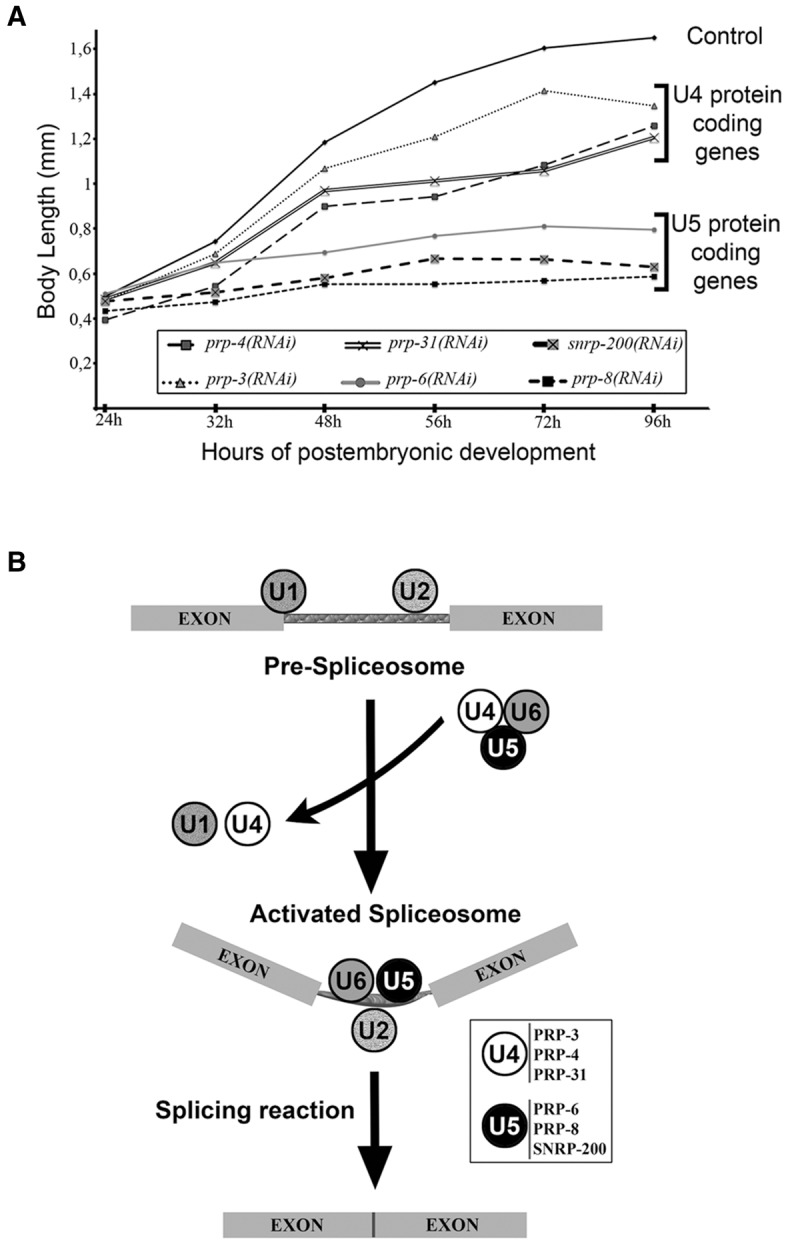
Retinitis pigmentosa (RP) is a rare genetic disease that causes gradual blindness through retinal degeneration. Intriguingly, seven of the 24 genes identified as responsible for the autosomal-dominant form (adRP) are ubiquitous spliceosome components whose impairment causes disease only in the retina. The fact that these proteins are essential in all organisms hampers genetic, genomic, and physiological studies, but we addressed these difficulties by using RNAi in Caenorhabditis elegans. Our study of worm phenotypes produced by RNAi of splicing-related adRP (s-adRP) genes functionally distinguishes between components of U4 and U5 snRNP complexes, because knockdown of U5 proteins produces a stronger phenotype. RNA-seq analyses of worms where s-adRP genes were partially inactivated by RNAi, revealed mild intron retention in developing animals but not in adults, suggesting a positive correlation between intron retention and transcriptional activity. Interestingly, RNAi of s-adRP genes produces an increase in the expression of atl-1 (homolog of human ATR), which is normally activated in response to replicative stress and certain DNA-damaging agents. The up-regulation of atl-1 correlates with the ectopic expression of the pro-apoptotic gene egl-1 and apoptosis in hypodermal cells, which produce the cuticle, but not in other cell types. Our model in C. elegans resembles s-adRP in two aspects: The phenotype caused by global knockdown of s-adRP genes is cell type-specific and associated with high transcriptional activity. Finally, along with a reduced production of mature transcripts, we propose a model in which the retina-specific cell death in s-adRP patients can be induced through genomic instability.

Keywords: C. elegans; RNA-seq; intron retention; retinitis pigmentosa; spliceosome.


Figures

FIGURE 1.
FIGURE 1.
C. elegans toolkit to study s-adRP. (A) Scheme of s-adRP genes in C. elegans including the regions that are targeted by RNAi clones (black bars), the deleted fragment in the prp-31(gk1094) and prp-8(gk3511) alleles (red bars), and the elements of the prp-8 and prp-31 reporters generated in this study (green rectangles). The prp-31(gk1094) allele consists of a 5-bp insertion/1953-bp deletion. prp-8(gk3511) is a 1823-bp deletion. (B) Quantification of prp genes’ expression levels after their respective inactivation by RNAi. mRNA levels of prp genes are represented relative to the expression in gfp(RNAi) control animals (arbitrary value of 1, indicated with a red line). Transcript levels are normalized against tbb-2 levels in each case. RNA for analysis was obtained from up to four biological replicates (n). RNA from samples used for RNA-seq analyses were included. Error bars represent standard error of the mean. (C) Representative confocal image showing a transgenic worm expressing the transgene sEx12486, which consists of the GFP under the control of a promoter region for prp-8. (D) Representative confocal image showing a transgenic worm expressing the transgene cerEx79, which consists of the fusion protein GFP::H2B under the control of prp-31 promoter and 3′UTR.
FIGURE 2.
FIGURE 2.
RNAi experiments classify s-adRP genes in two phenoclusters. (A) Developmental growth in animals treated with RNAi for s-adRP genes. Body length of wild-type worms with the indicated RNAi clones, starting from synchronized L1 and grown at 20°C. Mean body length of 50 worms per RNAi condition was scored at the indicated time points. Animal length was measured using the ImageJ software. Control worms were fed with the L4440 plasmid (empty vector). (B) Simplified scheme of the role of s-adRP genes in the splicing process. The six C. elegans s-adRP proteins are part of the tri-snRNP U4/U6·U5 complex. After the formation of the activated spliceosome, U5, but not U4, s-adRP proteins are required for subsequent splicing steps involving transesterification reactions. Exons are linked by thinner rectangles that represent an intron. White box: PRP-3, PRP-4, and PRP-31 are U4-specific, whereas PRP-6, PRP-8, and SNRNP-200 are U5-specific.
FIGURE 3.
FIGURE 3.
Intron retention caused by RNAi of s-adRP genes in different backgrounds and stages. Proportion of reads (73 bp) mapping within intron or in the intron–exon border in L3 N2 and smg-1 mutants or in adult glp-4 mutants, upon the indicated RNAis.
FIGURE 4.
FIGURE 4.
Up-regulation of atl-1 and egl-1 after RNAi of s-adRP genes follows a gradient from prp-8(RNAi) to prp-31(RNAi). (A) RNA-seq data of atl-1 and egl-1 after RNAi in wild-type worms. FPKM represents the fragments per kilobase of transcript per million mapped reads. Bars indicate the average “confidence_high” and “confidence_low” values provided by Cufflinks (Trapnell et al. 2012) for each gene. (B) Validation of the RNA-seq data by qPCR. mRNA levels of atl-1 and egl-1 upon RNAi of some s-adRP genes are represented relative to their expression in gfp(RNAi) control animals (arbitrary value of 1, indicated with a gray line). qPCR expression data were normalized to transcript levels of tbb-2. Three separate experiments were analyzed. Error bars represent the standard deviation. Student's t-test for independent samples was used to analyze the statistical significance: One, two, and three asterisks indicate P < 0.05, P < 0.01, and P < 0.001, respectively. (C) Both DNA insults, UV and hydroxyurea, produce an increase in atl-1 and egl-1 expression. Quantification of expression levels of atl-1 and egl-1 in wild-type animals treated either with UV (100 J/m2) or hydroxyurea (25 mM). Expression levels of these genes are represented relative to the ones in untreated worms.
FIGURE 5.
FIGURE 5.
egl-1::GFP expression is ectopically induced in prp-8(RNAi) animals. Expression of the transgene opIs56 [Pegl-1::2xNLS::GFP] after 24 h at 20°C in (A) control RNAi (empty vector) and (B) prp-8(RNAi). Size of the animals and the germline development stage indicate that in our experimental conditions prp-8(RNAi) worms develop to a similar stage as N2 during the first 24 h. prp-8(RNAi) worms ectopically express GFP in additional cells, including hypodermal seam cells (magnified area). Blue fluorescence is shown to label areas with autofluorescence. Images displayed are representative of three different experimental replicates. (C,D) Animals treated with prp-8(RNAi) display additional apoptotic cell corpses. The ced-6 mutant larvae treated with (C) control RNAi and (D) prp-8(RNAi). Black arrows indicate apoptotic cells (button-like refractile corpses) that were found in prp-8(RNAi) worms but not in control animals. The right panel shows a magnified image of the area highlighted with a white box.
FIGURE 6.
FIGURE 6.
prp-8(RNAi) animals display tissue-specific phenotype. (A) Larval arrest phenotype was observed in wild-type- and hypodermis-specific RNAi animals (rde-1 (ne219) V; KzIs9), while no obvious phenotype was observed in muscle-specific RNAi worms (rde-1 (ne219) V; KzIs20). Representative images were taken under the stereoscope after 48 h at 20°C. Scale bar, 1 mm. (B) Body length measure of wild-type, and hypodermis- and muscle-specific RNAi animals fed with prp-8(RNAi) and control (empty vector) clones. Animals synchronized at L1 stage were treated with the corresponding RNAi clone and grown at 20°C. More than 25 worms were measured after 48 h of treatment in each condition. Animal length is showed in millimeters and was scored using the ImageJ software. Statistical significance was calculated using Student's t-test for independent samples. Three asterisks indicate statistical significance with P < 0.001. Whiskers were plotted by Tukey's test. (C) Up-regulation of atl-1 and egl-1 after prp-8(RNAi) is tissue specific. qPCR results for atl-1 and egl-1 expression in wild-type and hypodermis- and muscle-specific RNAi animals represented in a bar graph. mRNA levels of these genes after prp-8(RNAi) are relative to their expression in control animals. Results obtained from three independent biological replicates. mRNA transcript levels of atl-1 and egl-1 are normalized against tbb-2 levels and represented in a log10 scale in both experiments. Error bars represent standard deviation.
FIGURE 7.
FIGURE 7.
Higher sensitivity to UV damage observed in prp-8(RNAi)-treated animals. After UV exposure, foci formation evidenced by the transgene opIs263 [Prpa-1::rpa-1::YFP+unc-119(+)] is more abundant in animals with partial inactivation of prp-8 compared with control worms (fed with empty vector clone). (A) Representative confocal images of transgenic worms carrying the RPA-1::YFP transgene under control and prp-8(RNAi) conditions. RNAi treatment started from L1 stage at 20°C. After 24 h, animals were exposed to a 100 J/m2 dose of UV-C radiation, and 24 h later foci formation was assessed through confocal microscopy. Foci formation was observed in somatic and germline cells in both conditions. White squares show magnified images of germline cells with RPA-1::YFP foci. (B) Quantification of foci formation per cell represented in a dispersion graph. Each square (control) and dot (prp-8(RNAi)) represents the number of cells displaying the corresponding amount of foci. Only somatic and germline cells that displayed one or more foci were scored.
FIGURE 8.
FIGURE 8.
Model for the tissue-specific apoptosis in s-adRP. (A) Similarly to humans, s-adRP genes are expressed in all C. elegans cell types. Partial inactivation of s-adRP genes causes tissue-specific defects both in humans and worms. (B) In normal condition, splicing occurs cotranscriptionally. (C) When the functioning of the splicesome is altered, the activity of the RNAPII is affected and R-loops (DNA–RNA hybrids) are produced, creating single-strand DNA regions that are more sensitive to DNA insults. Moreover, R-loops may cause collisions between the transcriptional and the replicative machineries.

Similar articles

Cited by

References

    1. Abu-Safieh L, Vithana EN, Mantel I, Holder GE, Pelosini L, Bird AC, Bhattacharya SS. 2006. A large deletion in the adRP gene PRPF31: evidence that haploinsufficiency is the cause of disease. Mol Vis 12: 384–388. - PubMed
    1. Aguilera A, García-Muse T. 2012. R loops: from transcription byproducts to threats to genome stability. Mol Cell 46: 115–124. - PubMed
    1. Aguilera A, García-Muse T. 2013. Causes of genome instability. Annu Rev Genet 47: 1–32. - PubMed
    1. Al-Hussaini H, Kam JH, Vugler A, Semo M, Jeffery G. 2008. Mature retinal pigment epithelium cells are retained in the cell cycle and proliferate in vivo. Mol Vis 14: 1784–1791. - PMC - PubMed
    1. Brambati A, Colosio A, Zardoni L, Galanti L, Liberi G. 2015. Replication and transcription on a collision course: eukaryotic regulation mechanisms and implications for DNA stability. Front Genet 6: 166. - PMC - PubMed

Publication types

MeSH terms

Substances