. 2015 Oct 21:15:759.
doi: 10.1186/s12885-015-1709-8.

Downregulation of programmed cell death 10 is associated with tumor cell proliferation, hyperangiogenesis and peritumoral edema in human glioblastoma

Affiliations

Downregulation of programmed cell death 10 is associated with tumor cell proliferation, hyperangiogenesis and peritumoral edema in human glioblastoma

Nicole Lambertz et al. BMC Cancer. .

Abstract

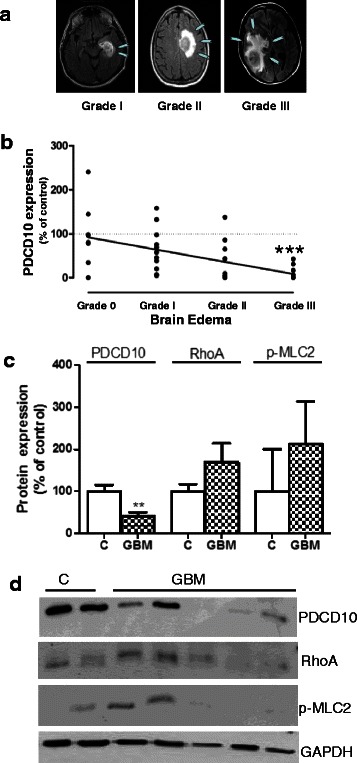
Background: Neovascularization and peritumoral edema are hallmarks of glioblastoma (GBM). Programmed cell death 10 (PDCD10) plays a pivotal role in regulating apoptosis, neoangiogenesis and vessel permeability and is implicated in certain tumor signaling pathways. However, little is known about PDCD10 in GBM. We aimed to investigate the expression pattern of PDCD10 and to identify the association of its expression with some molecular and clinical parameters in human GBM.

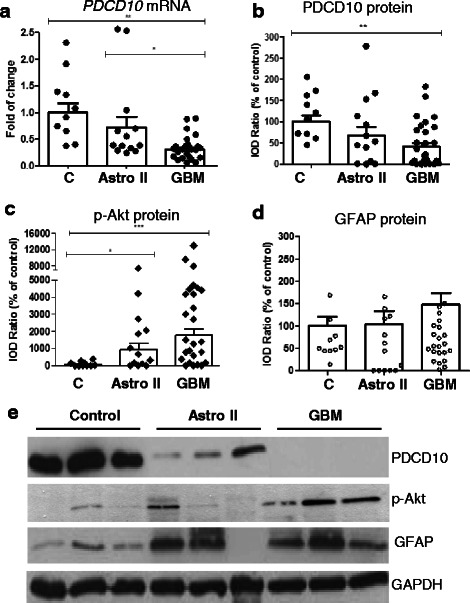
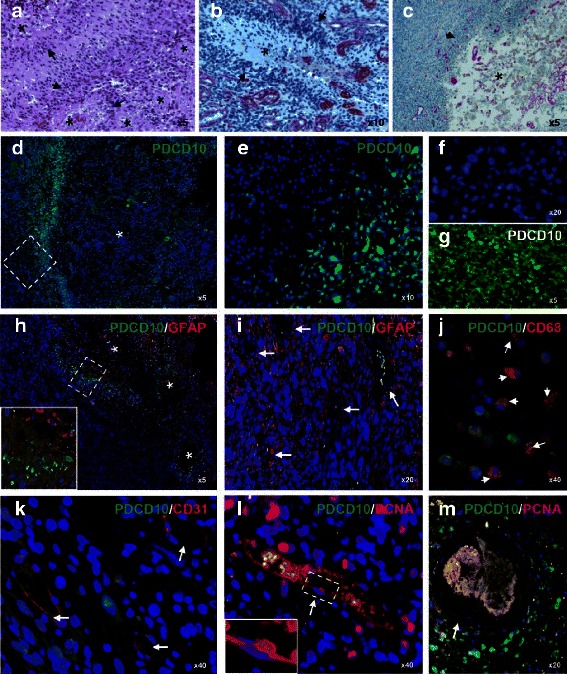
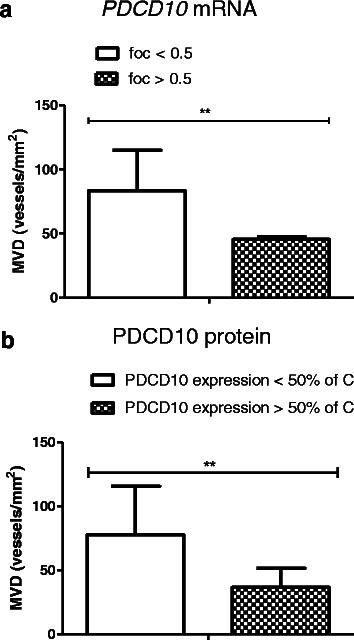
Methods: mRNA and protein expression of PDCD10 were examined respectively by real-time RT-PCR and Western blotting in GBM (n = 27), astrocytoma grade II (n = 13) and control (n = 11). The protein level of p-Akt and GFAP was detected by Western blot. Double-imunofluorecent staining was performed to reveal the cellular expression profile of PDCD10. Brain edema and microvascular density (MVD) were respectively analyzed based on pre-operative MRI and after laminin immnostaining. MGMT promoter methylation was detected by methylation specific PCR.

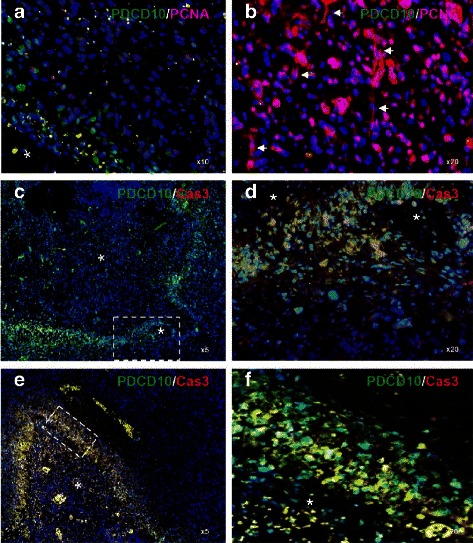
Results: mRNA and protein levels of PDCD10 were significantly downregulated in GBM, concomitantly accompanied by the activation of Akt. PDCD10 immunoreactivity was absent in proliferating tumor cells, endothelial cells and GFAP-positive cells, but exclusively present in the hypoxic pseudopalisading cells which underwent apoptosis. Moreover, loss of PDCD10 was associated with a higher MVD and a more severe peritumoral edema but not with MGMT promoter methylation in GBM.

Conclusion: We report for the first time that PDCD10 expression is downregulated in GBM, which is associated with the activation of Akt signaling protein. PDCD10 is potentially implicated in tumor proliferation and apoptosis, hyperangiogenesis and peritumoral edema in GBM.


Figures

Fig. 1
Fig. 1
Downregulation of PDCD10 was correlated to the activation of Akt in GBM. a Downregulation of PDCD10 mRNA. Real time RT-PCR demonstrated a downregulation of PDCD10 in a malignancy dependent manner in glioma. b-d Downregulation of PDCD10 protein expression was inversely correlated to the level of p-Akt in GBM. Semi-quantification of the blots confirmed a significant downregulation of PDCD10 protein level in GBM (b), which was inversely correlated to an activation of Akt (c). The level of GFAP was not significantly different among the control (c), astrocytoma grade II (Astro II) and GBM (d) group. e A representative blot showed the expression of PDCD10, phosphor-Akt (p-Akt), and GFAP in control (c), Astro II and GBM. * p < 0.05, ** p < 0.01 and *** p < 0.001, compared to c
Fig. 2
Fig. 2
Characterization of the regional and cellular localization of PDCD10 immunoreactivity in GBM. a Histopathological feature of GBM. H&E staining outlined multiple pseudopalisades. A typical pseudopalisade is composed of peripheral cellular pseudopalisading (arrows) around a necrotic center (asterisks). b and c Laminin staining. Microvascular hyperplasia (violet-colored structure) was found predominantly close to the pseudopalisading. Peripheral cellular pseudopalisading (arrows) was highlighted by the counterstaining. d-g Immunostaining of PDCD10. PDCD10 immunoreactivity was absent in the necrotic center (asterisk in d). High magnification view of the white box in d indicated that PDCD10 immunoreactivity was not detected in infiltrating tumor cells distant from necrotic area but was exclusively present in peripheral cellular pseudopalisading (e). Negative staining control omitting the primary antibody did not show any detectable signal (f), whereas the staining on a control brain section detected intensive immunoreactivity of PDCD10 (g). h-m Double staining of PDCD10 (green) with different cellular markers (red). PDCD10-positive cells in peripheral cellular pseudopalisading were not co-localized with GFAP (low magnification view in h and high magnification view in the inserted box). In the necrosis-distant area (infiltration area), tumor cells were positively labelled with GFAP but were negative to PDCD10-staining (i); meanwhile numerous microvessel-like structures in this infiltration area did not show PDCD10 immunoreactivity (arrows in i). Absence of PDCD10 in endothelial cells of the microvessels was confirmed by the double staining of PDCD10 and CD31 (arrows in k). These PDCD10-negative vessels exhibited proliferating activity as evidenced by the staining with PCNA (arrow and inserted box in l). In contrast, the thrombosed vessel (arrow in m) did not label with PCNA rather induced PDCD10 expression in surrounding tumor cells (m). Some of PDCD10 positive cells were co-labelled with macrophage marker CD68 (arrows in j)
Fig. 3
Fig. 3
The association of PDCD10 expression with tumor cell proliferation and with caspase 3 activation. a and b Double staining of PDCD10 and PCNA in GBM. PDCD10-positive cells (green) exclusively detected in pseudopalisading did not co-stain with PCNA (red) (a), whereas nearly all tumor cells the tumor microvessels (arrows in b) in the infiltration area appeared negative to PDCD10 staining but showed strong PCNA immunoreactivity (red), indicating an inverse correlation of PDCD10 expression and proliferation status of tumor cells and microvessels (b). c-f Double staining of PDCD10 and active caspase 3. Co-localization of the immunoreactivity of PDCD10 (green) and active caspase 3 (Cas3) (red) was exclusively detected in peripheral cellular pseudopalisadings, suggesting that an association of PDCD10 expression and apoptosis. Of note, the selective expression of PDCD10 in the pseudopalisading area was independent of whether pseudopalisading formed around a slight (c) or a severe necrotic zone (e). d and f, respectively, show the high magnification view of the white boxes in c and d. Asterisk in a and c-f indicates the necrotic center
Fig. 4
Fig. 4
Inverse association of the expression of PDCD10 with microvascular density (MVD) in GBM. a The association of PDCD10 mRNA expression and MVD. When GBM was subgrouped based on the mRNA level of PDCD10 (“fold of change” (foc) < 0.5, n = 20; or > 0.5, n = 7), a significantly higher MVD was observed in the subgroup expressing lower PDCD10 (foc < 0.5) in GBM. b The association of PDCD10 protein expression and MVD. When GBM was subgrouped based on the protein level of PDCD10 < 50 % of control (n = 22); or > 50 % of control (n = 5), a significantly higher MVD was observed in the subgroup expressing PDCD10 < 50 % of control. ** p < 0.01, compared to the group expressing lower mRNA (a) or protein (b) of PDCD10
Fig. 5
Fig. 5
The association of PDCD10 expression and the grade of brain edema in GBM. a Grading peritumoral edema in GBM. The grade of peritumoral edema in GBM was evaluated based on magnetic resonance imaging (MRI). b The association of PDCD10 protein expression and the grade of edema. The expression of PDCD10 was inversely correlated to the grade of peritumoral edema. *** p < 0.001, compared to edema grade 0. c and d The expression of total RhoA and phosphor-MLC2 (p-MLC2) in GBM. The expression of RhoA and phosphor-MLC2 (p-MLC2) appeared to be increased in GBM compared to the control (c) but did not show statistically significant difference (c). Thus, downregulation of PDCD10 did not seem to be correlated to the activation of RhoA signaling. The representative blots are shown in d. ** p < 0.01, compared with control (c)

References

    1. Burger PC, Vogel FS, Green SB, Strike TA. Glioblastoma multiforme and anaplastic astrocytoma. Pathologic criteria and prognostic implications. Cancer. 1985;56(5):1106–11. doi: 10.1002/1097-0142(19850901)56:5<1106::AID-CNCR2820560525>3.0.CO;2-2. - DOI - PubMed
    1. Gerstner ER, Batchelor TT. Antiangiogenic therapy for glioblastoma. Cancer J. 2012;18(1):45–50. doi: 10.1097/PPO.0b013e3182431c6f. - DOI - PMC - PubMed
    1. Bergametti F, Denier C, Labauge P, Arnoult M, Boetto S, Clanet M, et al. Mutations within the programmed cell death 10 gene cause cerebral cavernous malformations. Am J Hum Genet. 2005;76(1):42–51. doi: 10.1086/426952. - DOI - PMC - PubMed
    1. Guclu B, Ozturk AK, Pricola KL, Bilguvar K, Shin D, O'Roak BJ, et al. Mutations in apoptosis-related gene, PDCD10, cause cerebral cavernous malformation 3. Neurosurgery. 2005;57(5):1008–13. doi: 10.1227/01.NEU.0000180811.56157.E1. - DOI - PubMed
    1. Petit N, Blecon A, Denier C, Tournier-Lasserve E. Patterns of expression of the three cerebral cavernous malformation (CCM) genes during embryonic and postnatal brain development. Gene Expr Patterns. 2006;6(5):495–503. doi: 10.1016/j.modgep.2005.11.001. - DOI - PubMed

Publication types

MeSH terms