

Bayesian calibration of simulation models for supporting management of the elimination of the macroparasitic disease, Lymphatic Filariasis
- PMID: 26490350
- PMCID: PMC4618871
- DOI: 10.1186/s13071-015-1132-7
Bayesian calibration of simulation models for supporting management of the elimination of the macroparasitic disease, Lymphatic Filariasis
Abstract
Background: Mathematical models of parasite transmission can help integrate a large body of information into a consistent framework, which can then be used for gaining mechanistic insights and making predictions. However, uncertainty, spatial variability and complexity, can hamper the use of such models for decision making in parasite management programs.
Methods: We have adapted a Bayesian melding framework for calibrating simulation models to address the need for robust modelling tools that can effectively support management of lymphatic filariasis (LF) elimination in diverse endemic settings. We applied this methodology to LF infection and vector biting data from sites across the major LF endemic regions in order to quantify model parameters, and generate reliable predictions of infection dynamics along with credible intervals for modelled output variables. We used the locally calibrated models to estimate breakpoint values for various indicators of parasite transmission, and simulate timelines to parasite extinction as a function of local variations in infection dynamics and breakpoints, and effects of various currently applied and proposed LF intervention strategies.
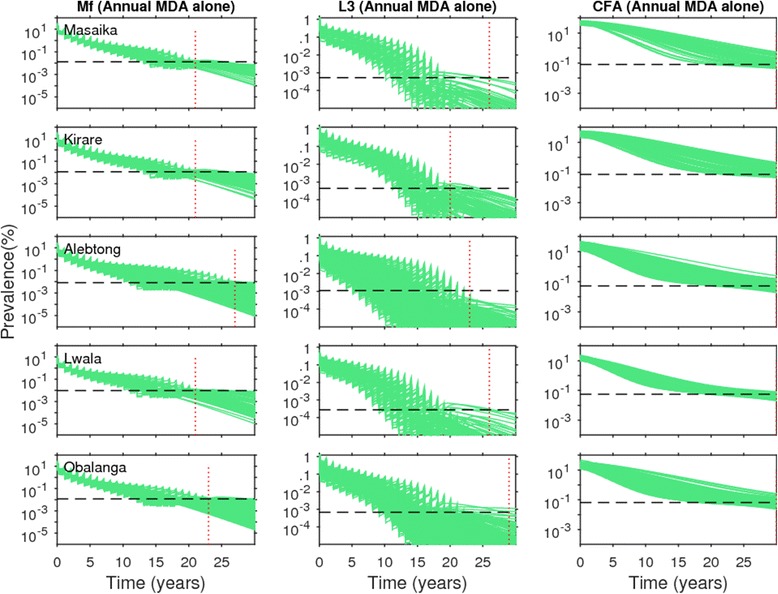
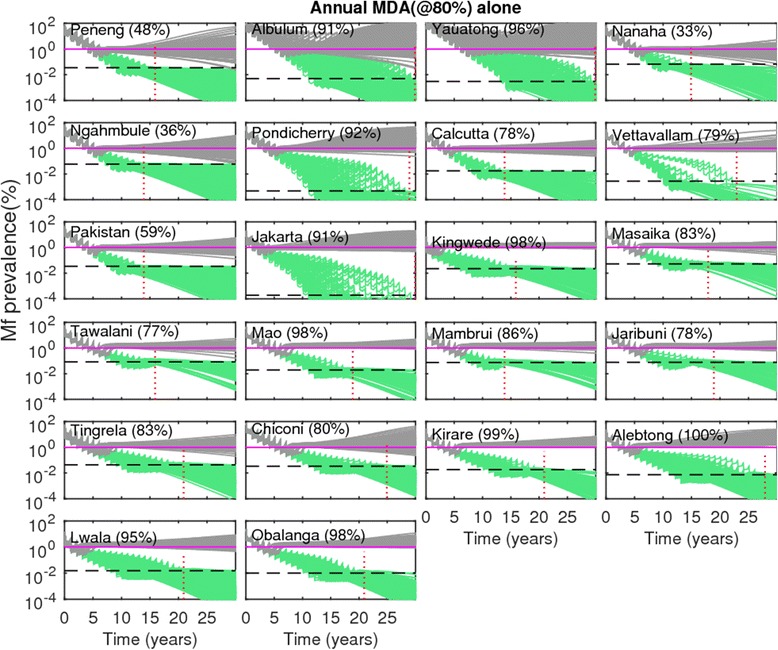
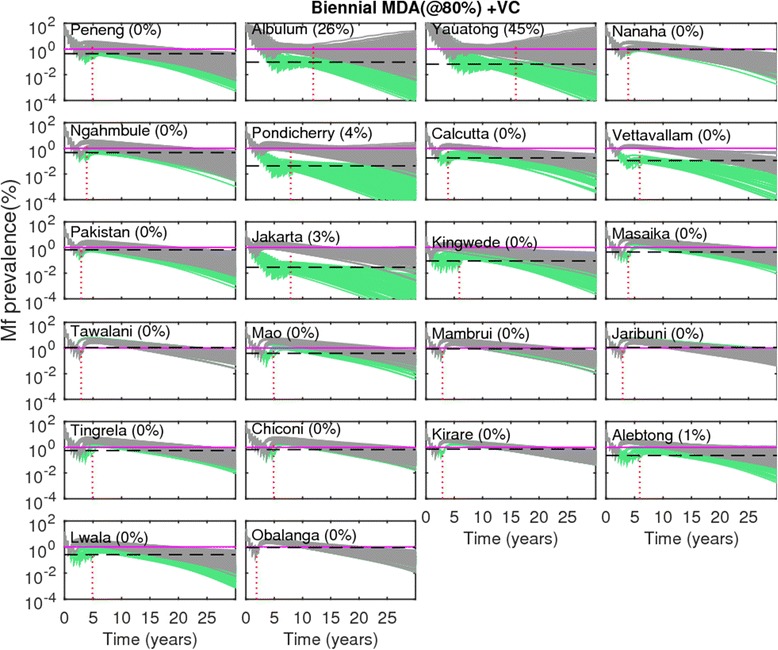
Results: We demonstrate that as a result of parameter constraining by local data, breakpoint values for all the major indicators of LF transmission varied significantly between the sites investigated. Intervention simulations using the fitted models showed that as a result of heterogeneity in local transmission and extinction dynamics, timelines to parasite elimination in response to the current Mass Drug Administration (MDA) and various proposed MDA with vector control strategies also varied significantly between the study sites. Including vector control, however, markedly reduced the duration of interventions required to achieve elimination as well as decreased the risk of recrudescence following stopping of MDA.
Conclusions: We have demonstrated how a Bayesian data-model assimilation framework can enhance the use of transmission models for supporting reliable decision making in the management of LF elimination. Extending this framework for delivering predictions in settings either lacking or with only sparse data to inform the modelling process, however, will require development of procedures to estimate and use spatio-temporal variations in model parameters and inputs directly, and forms the next stage of the work reported here.
Figures


Similar articles
-
Geographic and ecologic heterogeneity in elimination thresholds for the major vector-borne helminthic disease, lymphatic filariasis.BMC Biol. 2010 Mar 17;8:22. doi: 10.1186/1741-7007-8-22. BMC Biol. 2010. PMID: 20236528 Free PMC article.
-
Heterogeneous dynamics, robustness/fragility trade-offs, and the eradication of the macroparasitic disease, lymphatic filariasis.BMC Med. 2016 Jan 28;14:14. doi: 10.1186/s12916-016-0557-y. BMC Med. 2016. PMID: 26822124 Free PMC article.
-
Continental-scale, data-driven predictive assessment of eliminating the vector-borne disease, lymphatic filariasis, in sub-Saharan Africa by 2020.BMC Med. 2017 Sep 27;15(1):176. doi: 10.1186/s12916-017-0933-2. BMC Med. 2017. PMID: 28950862 Free PMC article.
-
Modelling lymphatic filariasis transmission and control: modelling frameworks, lessons learned and future directions.Adv Parasitol. 2015 Mar;87:249-91. doi: 10.1016/bs.apar.2014.12.005. Epub 2015 Feb 13. Adv Parasitol. 2015. PMID: 25765197 Review.
-
Transmission models and management of lymphatic filariasis elimination.Adv Exp Med Biol. 2010;673:157-71. doi: 10.1007/978-1-4419-6064-1_11. Adv Exp Med Biol. 2010. PMID: 20632536 Review.
Cited by
-
Mathematical modelling of lymphatic filariasis elimination programmes in India: required duration of mass drug administration and post-treatment level of infection indicators.Parasit Vectors. 2016 Sep 13;9(1):501. doi: 10.1186/s13071-016-1768-y. Parasit Vectors. 2016. PMID: 27624157 Free PMC article.
-
The roadmap towards elimination of lymphatic filariasis by 2030: insights from quantitative and mathematical modelling.Gates Open Res. 2019 Sep 13;3:1538. doi: 10.12688/gatesopenres.13065.1. eCollection 2019. Gates Open Res. 2019. PMID: 31728440 Free PMC article.
-
Modelling the Impact of Vector Control on Lymphatic Filariasis Programs: Current Approaches and Limitations.Clin Infect Dis. 2021 Jun 14;72(Suppl 3):S152-S157. doi: 10.1093/cid/ciab191. Clin Infect Dis. 2021. PMID: 33905475 Free PMC article. Review.
-
Predicting lymphatic filariasis elimination in data-limited settings: A reconstructive computational framework for combining data generation and model discovery.PLoS Comput Biol. 2020 Jul 21;16(7):e1007506. doi: 10.1371/journal.pcbi.1007506. eCollection 2020 Jul. PLoS Comput Biol. 2020. PMID: 32692741 Free PMC article.
-
Low transmission of Wuchereria bancrofti in cross-border districts of Côte d'Ivoire: A great step towards lymphatic filariasis elimination in West Africa.PLoS One. 2020 Apr 13;15(4):e0231541. doi: 10.1371/journal.pone.0231541. eCollection 2020. PLoS One. 2020. PMID: 32282840 Free PMC article.
References
-
- Anderson RM, May RM. Infectious diseases of humans: dynamics and control. Oxford: Oxford University Press; 1991.
Publication types
MeSH terms
LinkOut - more resources
Full Text Sources
Other Literature Sources
