

Interaction of Spin-Labeled Lipid Membranes with Transition Metal Ions
- PMID: 26490692
- PMCID: PMC4762260
- DOI: 10.1021/acs.jpcb.5b08165
Interaction of Spin-Labeled Lipid Membranes with Transition Metal Ions
Abstract
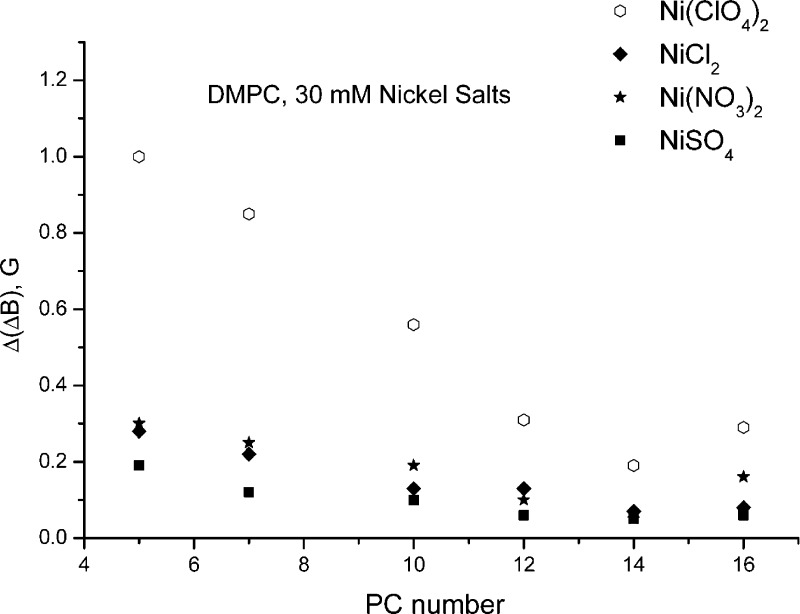
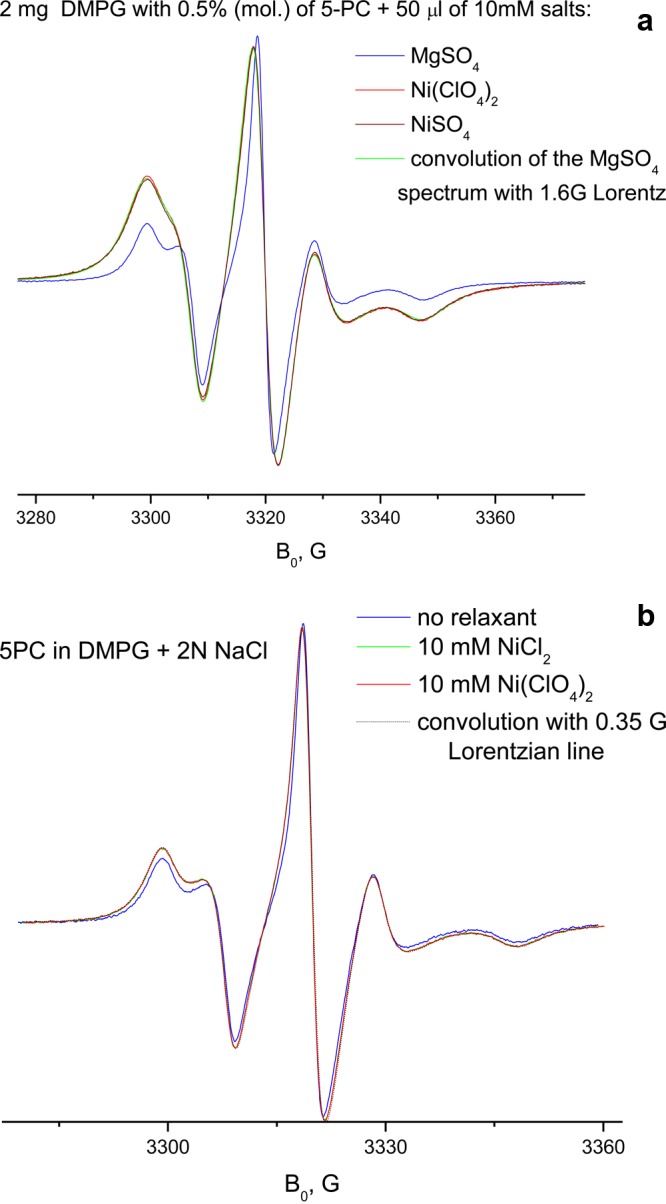
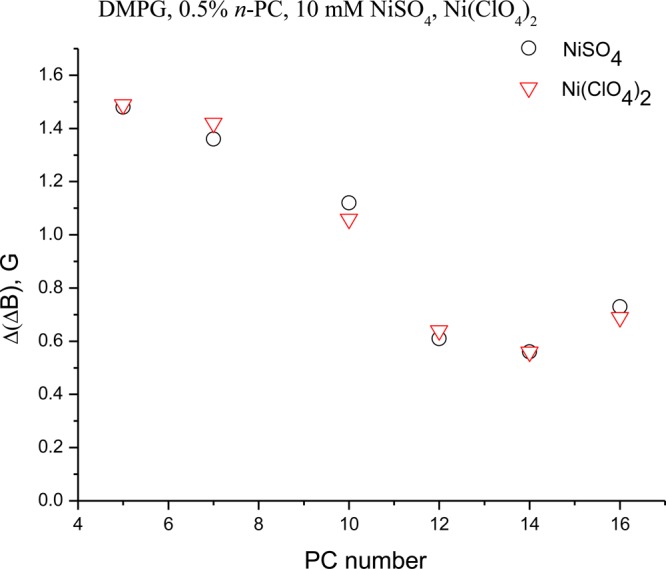
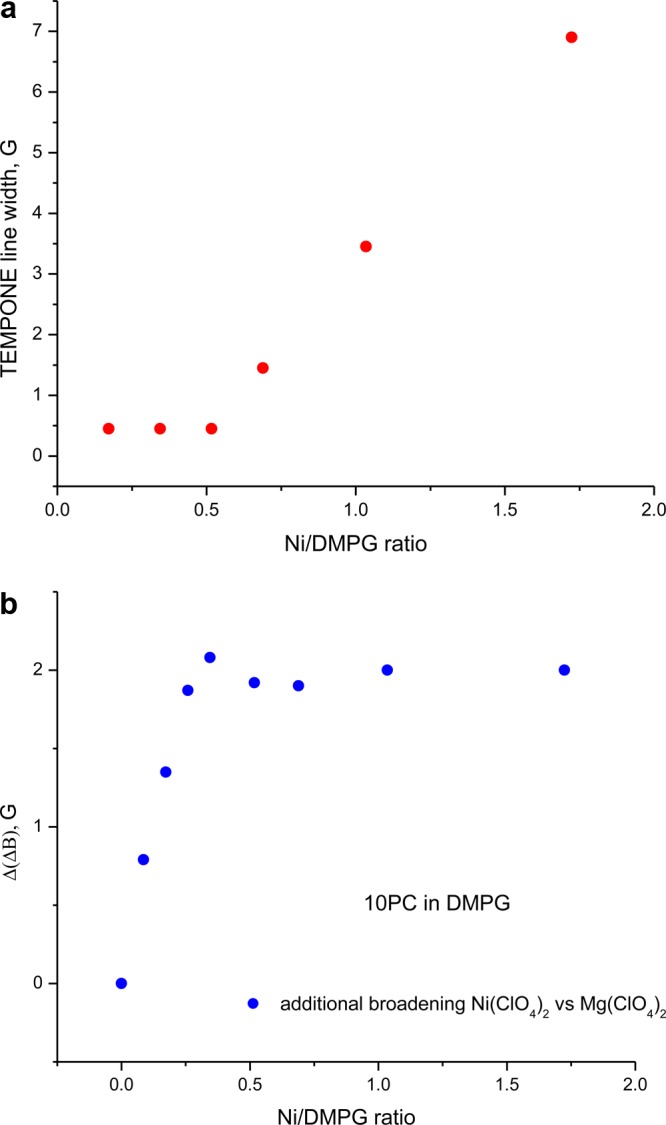
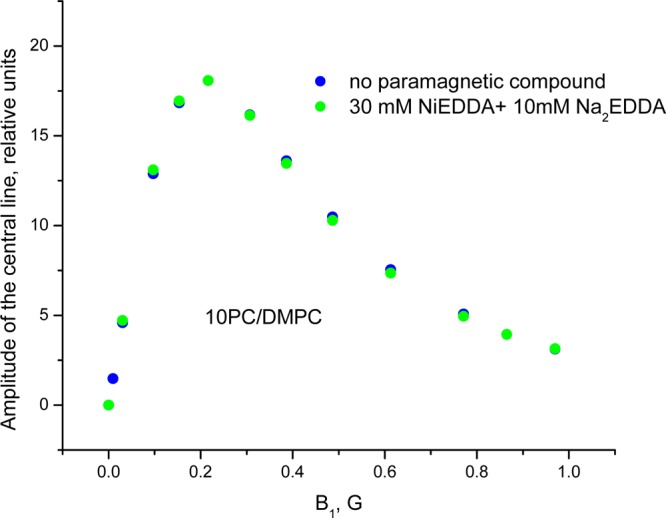
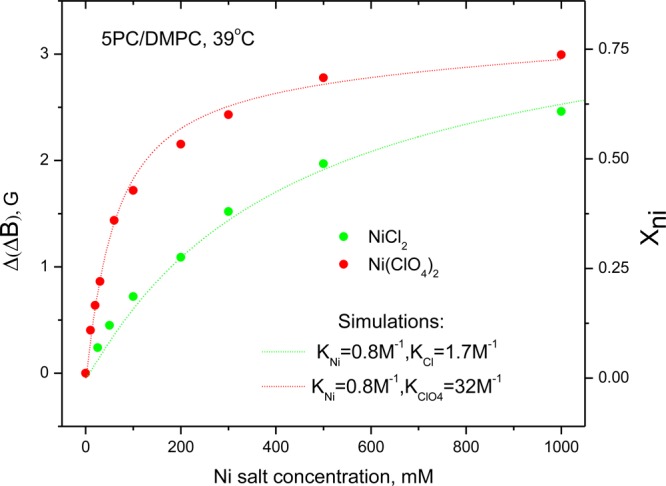
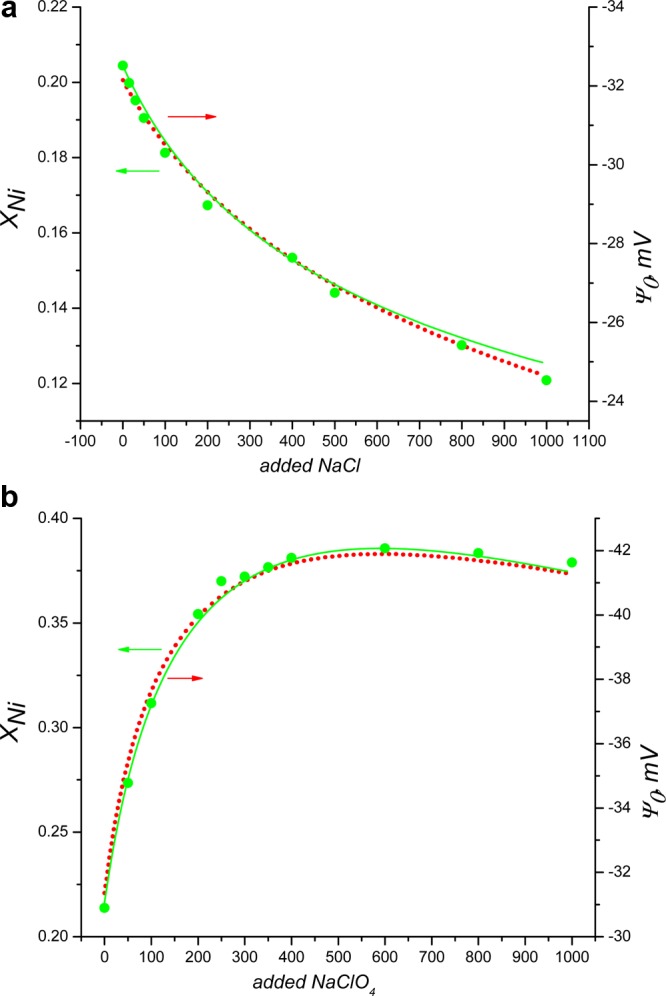
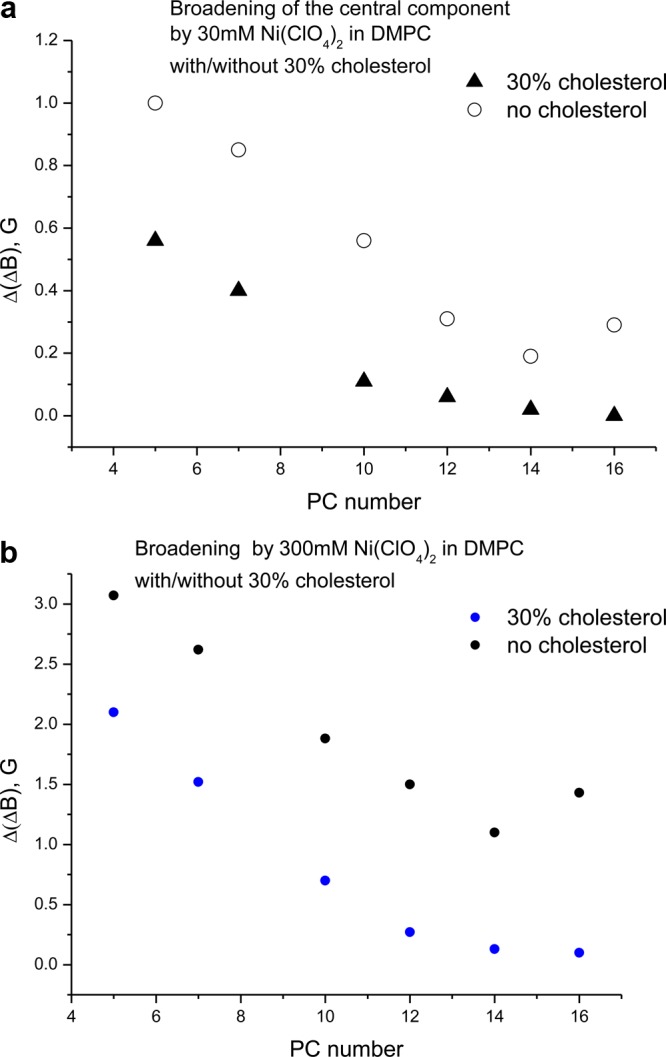
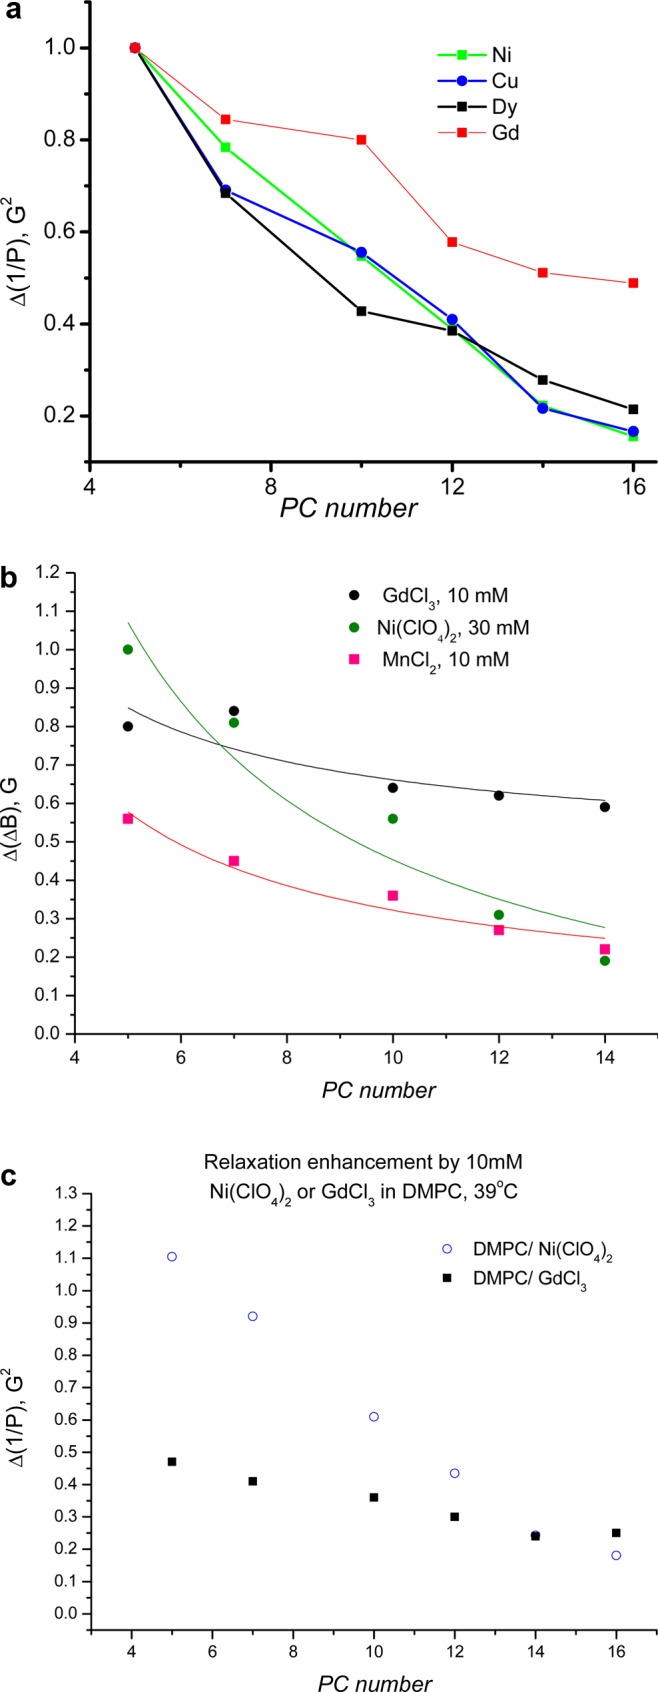
The large values of spin relaxation enhancement (RE) for PC spin-labels in the phospholipid membrane induced by paramagnetic metal salts dissolved in the aqueous phase can be explained by Heisenberg spin exchange due to conformational fluctuations of the nitroxide group as a result of membrane fluidity, flexibility of lipid chains, and, possibly, amphiphilic nature of the nitroxide label. Whether the magnetic interaction occurs predominantly via Heisenberg spin exchange (Ni) or by the dipole-dipole (Gd) mechanism, it is essential for the paramagnetic ion to get into close proximity to the nitroxide moiety for efficient RE. For different salts of Ni the RE in phosphatidylcholine membranes follows the anionic Hofmeister series and reflects anion adsorption followed by anion-driven attraction of paramagnetic cations on the choline groups. This adsorption is higher for chaotropic ions, e.g., perchlorate. (A chaotropic agent is a molecule in water solution that can disrupt the hydrogen bonding network between water molecules.) However, there is no anionic dependence of RE for model membranes made from negatively charged lipids devoid of choline groups. We used Ni-induced RE to study the thermodynamics and electrostatics of ion/membrane interactions. We also studied the effect of membrane composition and the phase state on the RE values. In membranes with cholesterol a significant difference is observed between PC labels with nitroxide tethers long enough vs not long enough to reach deep into the membrane hydrophobic core behind the area of fused cholesterol rings. This study indicates one must be cautious in interpreting data obtained by PC labels in fluid membranes in terms of probing membrane properties at different immersion depths when it can be affected by paramagnetic species at the membrane surface.
Conflict of interest statement
The authors declare no competing financial interest.
Figures
Similar articles
-
Mechanism of relaxation enhancement of spin labels in membranes by paramagnetic ion salts: dependence on 3d and 4f ions and on the anions.J Magn Reson. 2001 Feb;148(2):221-37. doi: 10.1006/jmre.2000.2236. J Magn Reson. 2001. PMID: 11237628
-
Accessibility of spin-labeled phospholipids in anionic and zwitterionic bilayer membranes to paramagnetic relaxation agents. Continuous wave power saturation EPR studies.Biochim Biophys Acta. 1993 Aug 15;1150(2):155-61. doi: 10.1016/0005-2736(93)90084-d. Biochim Biophys Acta. 1993. PMID: 8394135
-
Microimmiscibility and three-dimensional dynamic structures of phosphatidylcholine-cholesterol membranes: translational diffusion of a copper complex in the membrane.Biochemistry. 1990 Aug 28;29(34):7936-45. doi: 10.1021/bi00486a023. Biochemistry. 1990. PMID: 2261449
-
Time-resolved electron spin resonance studies of spin-labelled lipids in membranes.Chem Phys Lipids. 2006 Jun;141(1-2):142-57. doi: 10.1016/j.chemphyslip.2006.02.009. Epub 2006 Mar 13. Chem Phys Lipids. 2006. PMID: 16564516 Review.
-
Conformational dynamics and distribution of nitroxide spin labels.Prog Nucl Magn Reson Spectrosc. 2013 Jul;72:42-60. doi: 10.1016/j.pnmrs.2013.03.001. Epub 2013 Apr 18. Prog Nucl Magn Reson Spectrosc. 2013. PMID: 23731861 Review.
Cited by
-
Time-Frequency Analysis of Two-Dimensional Electron Spin Resonance Signals.J Phys Chem A. 2023 Sep 21;127(37):7793-7801. doi: 10.1021/acs.jpca.3c02708. Epub 2023 Sep 12. J Phys Chem A. 2023. PMID: 37699569 Free PMC article.
-
Microsecond Exchange Processes Studied by Two-Dimensional ESR at 95 GHz.J Am Chem Soc. 2020 Dec 23;142(51):21368-21381. doi: 10.1021/jacs.0c09469. Epub 2020 Dec 11. J Am Chem Soc. 2020. PMID: 33305945 Free PMC article.
-
Theory and Least Squares Fitting of CW ESR Saturation Spectra Using the MOMD Model.Appl Magn Reson. 2022 May;53(3-5):699-715. doi: 10.1007/s00723-021-01390-7. Epub 2021 Jul 18. Appl Magn Reson. 2022. PMID: 35431460 Free PMC article.
-
Systematic Quantification of Electron Transfer in a Bare Phospholipid Membrane Using Nitroxide-Labeled Stearic Acids: Distance Dependence, Kinetics, and Activation Parameters.Langmuir. 2020 Sep 8;36(35):10429-10437. doi: 10.1021/acs.langmuir.0c01585. Epub 2020 Aug 25. Langmuir. 2020. PMID: 32787070 Free PMC article.
References
-
- Paula S.; Deamer D. W. Membrane Permeability Barriers to Ionic and Polar Solutes. Curr. Top. Membr. 1999, 48, 77–95. 10.1016/S0070-2161(08)61042-4. - DOI
Publication types
MeSH terms
Substances
Grants and funding
LinkOut - more resources
Full Text Sources
Other Literature Sources
