Meta-Analysis
. 2015 Oct 22:6:8570.
doi: 10.1038/ncomms9570.

The transcriptional landscape of age in human peripheral blood

Marjolein J Peters  1 Roby Joehanes  2   3 Luke C Pilling  4 Claudia Schurmann  5   6 Karen N Conneely  7 Joseph Powell  8   9 Eva Reinmaa  10 George L Sutphin  11 Alexandra Zhernakova  12 Katharina Schramm  13   14 Yana A Wilson  15 Sayuko Kobes  16 Taru Tukiainen  17   18 NABEC/UKBEC ConsortiumYolande F Ramos  19 Harald H H Göring  20 Myriam Fornage  21   22 Yongmei Liu  23 Sina A Gharib  24 Barbara E Stranger  25 Philip L De Jager  26 Abraham Aviv  27 Daniel Levy  2   3 Joanne M Murabito  2   28 Peter J Munson  29 Tianxiao Huan  2   3 Albert Hofman  30 André G Uitterlinden  1   30 Fernando Rivadeneira  1   30 Jeroen van Rooij  1 Lisette Stolk  1 Linda Broer  1 Michael M P J Verbiest  1 Mila Jhamai  1 Pascal Arp  1 Andres Metspalu  10 Liina Tserel  31 Lili Milani  10 Nilesh J Samani  32   33 Pärt Peterson  31 Silva Kasela  34 Veryan Codd  32   33 Annette Peters  35   36 Cavin K Ward-Caviness  35 Christian Herder  37 Melanie Waldenberger  35   36 Michael Roden  37   38 Paula Singmann  35   36 Sonja Zeilinger  35   36 Thomas Illig  39 Georg Homuth  5 Hans-Jörgen Grabe  40 Henry Völzke  41 Leif Steil  5 Thomas Kocher  42 Anna Murray  4 David Melzer  4 Hanieh Yaghootkar  43 Stefania Bandinelli  44 Eric K Moses  45 Jack W Kent  20 Joanne E Curran  20 Matthew P Johnson  20 Sarah Williams-Blangero  20 Harm-Jan Westra  12   46   47   48 Allan F McRae  49   50 Jennifer A Smith  51 Sharon L R Kardia  51 Iiris Hovatta  52   53 Markus Perola  10   17   18 Samuli Ripatti  17   18   54   55 Veikko Salomaa  18 Anjali K Henders  9 Nicholas G Martin  56 Alicia K Smith  57 Divya Mehta  58 Elisabeth B Binder  58 K Maria Nylocks  57 Elizabeth M Kennedy  7 Torsten Klengel  58 Jingzhong Ding  59 Astrid M Suchy-Dicey  60 Daniel A Enquobahrie  60 Jennifer Brody  61 Jerome I Rotter  62 Yii-Der I Chen  62 Jeanine Houwing-Duistermaat  63 Margreet Kloppenburg  64   65 P Eline Slagboom  19 Quinta Helmer  63 Wouter den Hollander  19 Shannon Bean  11 Towfique Raj  66 Noman Bakhshi  15 Qiao Ping Wang  15 Lisa J Oyston  15 Bruce M Psaty  67   68   69   70 Russell P Tracy  71 Grant W Montgomery  56 Stephen T Turner  72 John Blangero  20 Ingrid Meulenbelt  19 Kerry J Ressler  57 Jian Yang  49   50 Lude Franke  12 Johannes Kettunen  17   18   73 Peter M Visscher  49   50 G Gregory Neely  15 Ron Korstanje  11 Robert L Hanson  16 Holger Prokisch  13   14 Luigi Ferrucci  74 Tonu Esko  10   46   75   76 Alexander Teumer  5 Joyce B J van Meurs  1 Andrew D Johnson  2   3
Collaborators, Affiliations
Meta-Analysis

The transcriptional landscape of age in human peripheral blood

Marjolein J Peters et al. Nat Commun. .

Abstract

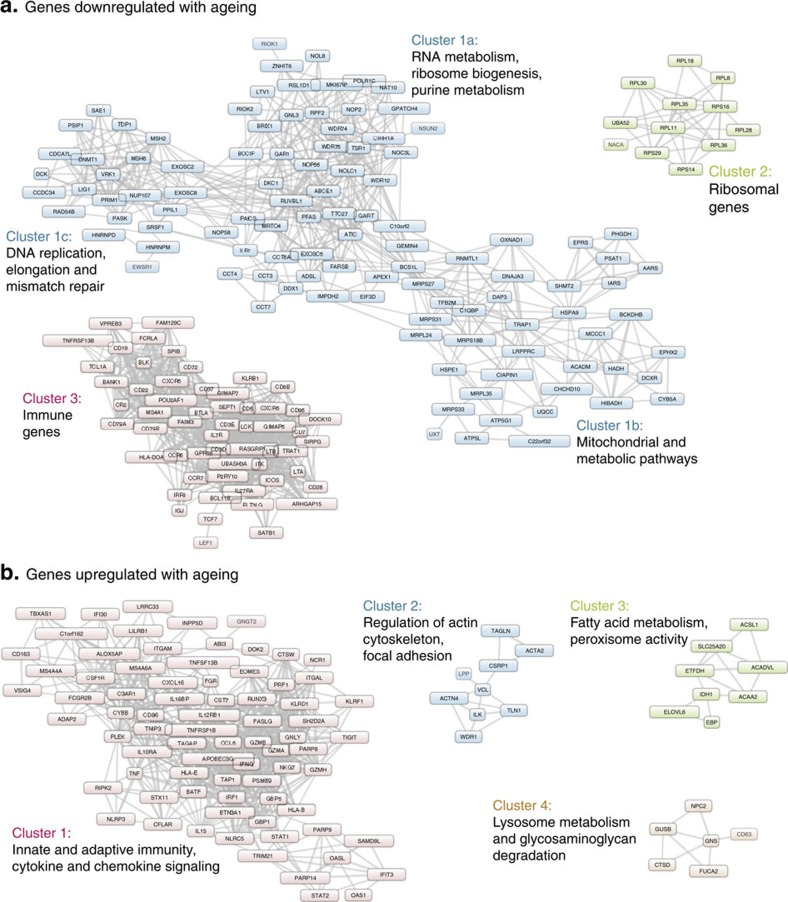
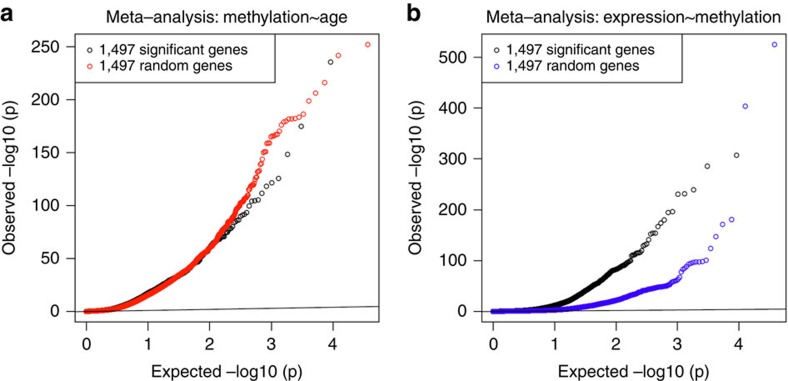
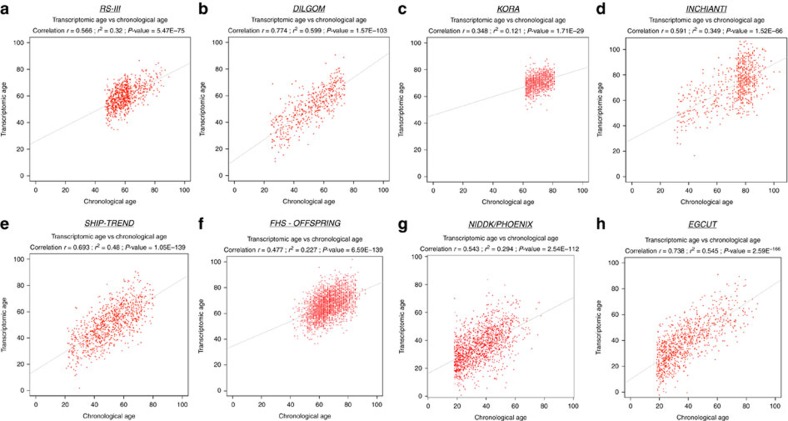
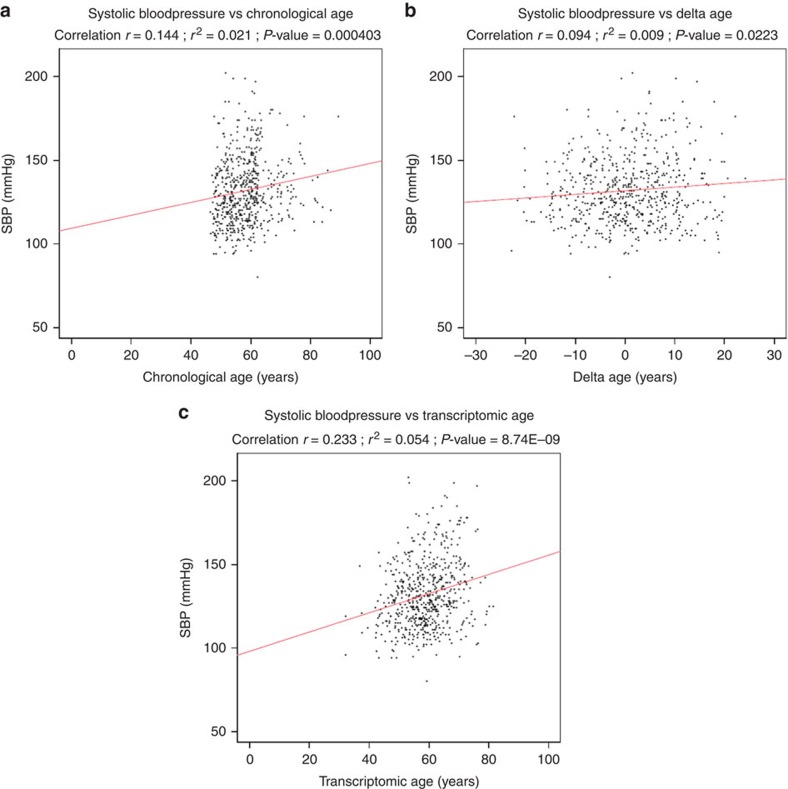
Disease incidences increase with age, but the molecular characteristics of ageing that lead to increased disease susceptibility remain inadequately understood. Here we perform a whole-blood gene expression meta-analysis in 14,983 individuals of European ancestry (including replication) and identify 1,497 genes that are differentially expressed with chronological age. The age-associated genes do not harbor more age-associated CpG-methylation sites than other genes, but are instead enriched for the presence of potentially functional CpG-methylation sites in enhancer and insulator regions that associate with both chronological age and gene expression levels. We further used the gene expression profiles to calculate the 'transcriptomic age' of an individual, and show that differences between transcriptomic age and chronological age are associated with biological features linked to ageing, such as blood pressure, cholesterol levels, fasting glucose, and body mass index. The transcriptomic prediction model adds biological relevance and complements existing epigenetic prediction models, and can be used by others to calculate transcriptomic age in external cohorts.


Figures

Figure 1
Figure 1. Pathway analysis on the clusters of co-expressed genes.
We ran a co-functionality network analysis on 897 downregulated genes with age (negative effect direction) and 600 upregulated genes with age (positive effect direction) using GeneNetwork. With a correlation threshold of 0.7, we selected all clusters bigger than four genes and ran per-cluster pathway analyses using KEGG, Reactome, and GO-terms in WEBGESTALT. Benjamini & Hochberg FDR was used for multiple testing corrections. The significant threshold 0.05 after correction for multiple testing was applied. (a) Three clusters of downregulated genes with age and (b) four clusters of genes upregulated with age were enriched for functional pathways in KEGG, Reactome, and GO terms; the specific pathways are mentioned next to the (sub)cluster names.
Figure 2
Figure 2. Age-associated genes are enriched for the presence of potentially functional methylation sites.
(a) Quantile–quantile (QQ) plot of the observed P-values (−log10P) for the methylation–age associations. The plot in black shows pvalues from the 1,497 significant age-associated genes, whereas the plot in red shows pvalues for 1,497 random genes. We do not see enrichment for the 1,497 age-associated genes. (b) QQ plot of the observed P-values (−log10P) for the expression–methylation associations. The plot in black shows P values from the 1,497 significant age-associated genes, whereas the plot in blue shows pvalues for 1,497 random genes. The age-associated genes are enriched for CpG methylation sites that associate with gene expression levels.
Figure 3
Figure 3. Transcriptomic age versus chronological age.
This figure represents the correlations between chronological age (x axis) and transcriptomic age (y axis) in eight different cohorts: (a) RS-III, (b) DILGOM, (c) KORA, (d) InCHIANTI, (e) SHIP-TREND, (f) FHS-OFFSPRING, (g) NIDDK/PHOENIX and (h) EGCUT. Transcriptomic age was calculated using a cohort-specific prediction formula and the measured gene expression levels of 11,908 genes. The correlation between chronological age and transcriptomic age was significant in all cohorts (P<2E−29).
Figure 4
Figure 4. The added value of the transcriptomic predictor.
To show the added value of the transcriptomic predictor, we choose one biological ageing phenotype systolic blood pressure (SBP), and plotted its correlation with chronological age (a), delta age (b) and the transcriptomic age (c) in the Rotterdam Study (n=597 samples with SBP data available). Delta age represents the difference between chronological age and transcriptomic age. SBP was plotted on the y axis, and the age-related values were plotted on the x axes. SBP was significantly associated with chronological age (P=4.0E−04), but SBP was even stronger associated with transcriptomic age (calculated with a cohort-specific prediction formula based on gene expression levels) (P=8.7E−09), Therefore, the transcriptomic predictor adds value over chronological age alone. Other biological ageing phenotypes showed the same pattern.

References

    1. Eicher J. D. et al. GRASP v2.0: an update on the Genome-Wide Repository of Associations between SNPs and phenotypes. Nucleic Acids Res. 43, D799–D804 (2014). - PMC - PubMed
    1. Welter D. et al. The NHGRI GWAS Catalog, a curated resource of SNP-trait associations. Nucleic Acids Res. 42, D1001–D1006 (2014). - PMC - PubMed
    1. Anselmi C. V. et al. Association of the FOXO3A locus with extreme longevity in a southern Italian centenarian study. Rejuvenation Res. 12, 95–104 (2009). - PubMed
    1. Broer L. et al. GWAS of longevity in CHARGE consortium confirms APOE and FOXO3 candidacy. J. Gerontol. A Biol. Sci. Med. Sci. 70, 110–118 (2014). - PMC - PubMed
    1. Nebel A. et al. A genome-wide association study confirms APOE as the major gene influencing survival in long-lived individuals. Mech. Ageing Dev. 132, 324–330 (2011). - PubMed

Publication types