. 2015 Dec 1;108(3):387-98.
doi: 10.1093/cvr/cvv231. Epub 2015 Oct 21.

Ryanodine receptor cluster fragmentation and redistribution in persistent atrial fibrillation enhance calcium release

Affiliations

Ryanodine receptor cluster fragmentation and redistribution in persistent atrial fibrillation enhance calcium release

Niall Macquaide et al. Cardiovasc Res. .

Abstract

Aims: In atrial fibrillation (AF), abnormalities in Ca(2+) release contribute to arrhythmia generation and contractile dysfunction. We explore whether ryanodine receptor (RyR) cluster ultrastructure is altered and is associated with functional abnormalities in AF.

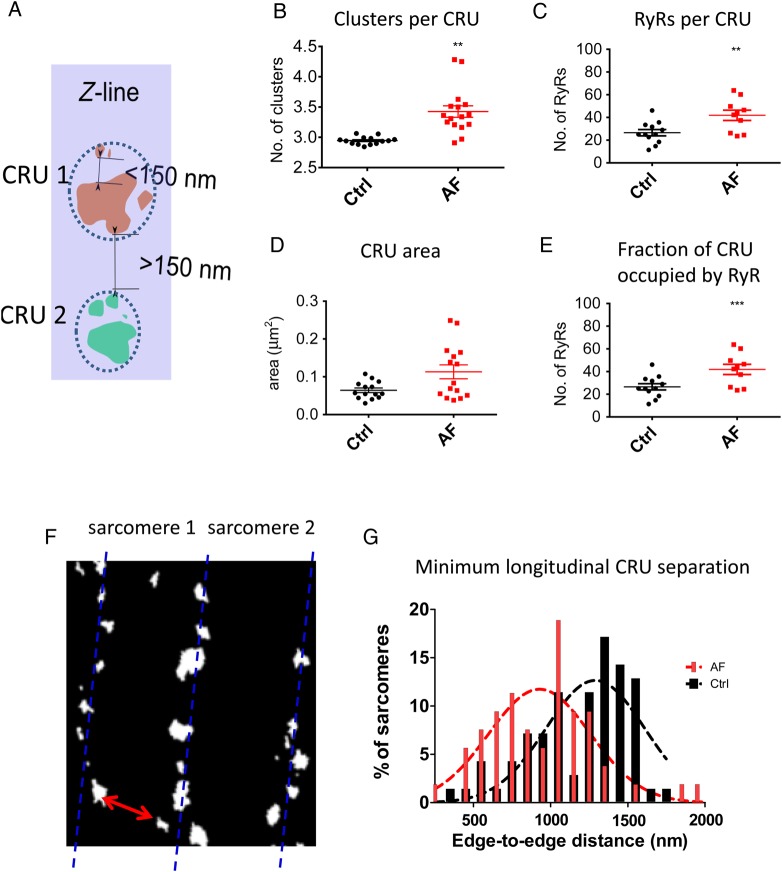
Methods and results: Using high-resolution confocal microscopy (STED), we examined RyR cluster morphology in fixed atrial myocytes from sheep with persistent AF (N = 6) and control (Ctrl; N = 6) animals. RyR clusters on average contained 15 contiguous RyRs; this did not differ between AF and Ctrl. However, the distance between clusters was significantly reduced in AF (288 ± 12 vs. 376 ± 17 nm). When RyR clusters were grouped into Ca(2+) release units (CRUs), i.e. clusters separated by <150 nm, CRUs in AF had more clusters (3.43 ± 0.10 vs. 2.95 ± 0.02 in Ctrl), which were more dispersed. Furthermore, in AF cells, more RyR clusters were found between Z lines. In parallel experiments, Ca(2+) sparks were monitored in live permeabilized myocytes. In AF, myocytes had >50% higher spark frequency with increased spark time to peak (TTP) and duration, and a higher incidence of macrosparks. A computational model of the CRU was used to simulate the morphological alterations observed in AF cells. Increasing cluster fragmentation to the level observed in AF cells caused the observed changes, i.e. higher spark frequency, increased TTP and duration; RyR clusters dispersed between Z-lines increased the occurrence of macrosparks.

Conclusion: In persistent AF, ultrastructural reorganization of RyR clusters within CRUs is associated with overactive Ca(2+) release, increasing the likelihood of propagating Ca(2+) release.

Keywords: Atrial fibrillation; Atrial myocytes; Ryanodine receptor; Sarcoplasmic reticulum; Super-resolution microscopy.


Figures

Figure 1
Figure 1
Deconvolved STED microscopy resolves RyR sub-cluster formations in atrial myocytes. (A) Average of the same three fluorescent beads aligned on their peaks from confocal (i) and STED (ii) recordings, allowing a ∼4–6× improvement in resolution. (B) RyR antibody labelling in an atrial myocyte visualized using confocal microscopy. (C–F) Optical and software-based methods used to allow RyR cluster resolution in a region of an atrial myocyte (i), with further zoom in of the region outlined in red (ii). (C) Conventional confocal image; (D) the raw STED image; (E) after deconvolution noise is reduced with more defined edges of each sub-cluster; (F) RyR clusters are thresholded to allow morphology quantification. (G) Individual colours delineate 10 clusters taken from F (ii). (H) Method for RyR cluster size quantification: a grid of single RyRs (blue squares) are superimposed on the thresholded image. Scale bars: (B) 5 µm; (Ci–Fi) 250 nm; (Cii–Fii)100 nm.
Figure 2
Figure 2
Quantification of RyR cluster size. (A and B) Typical deconvolved STED (i) and thresholded STED (ii) from Ctrl and AF cells; scale bars: upper panel 500 nm, lower 200 nm. (C) Mean RyR cluster size; nclusters = 2581 and 1261, ncells = 14 and 14 in 4 Ctrl and 4 AF animals, respectively. (D) Distribution histogram of RyRs (fraction of the total number of RyRs) as a function of RyR cluster size in Ctrl (black) and AF (red). The two distributions have been fit with the sum of an exponential and Gaussian distribution; right panel with bin size 10. (E) Cumulative histogram of the distribution of RyRs according to cluster size (same data as in D). The majority of RyRs reside in clusters containing <6 RyR. (F) Mean nearest neighbour distance between individual RyR clusters in Ctrl and AF, quantified by distances between the centre of each cluster (***P = 0.006). Data are mean ± SEM.
Figure 3
Figure 3
Quantification of alterations of CRU morphology and separation in AF. (A) Criteria for cluster grouping within CRUs defined as functionally grouped clusters if within the 150 nm edge to edge of each other (shown all of similar colour). (B) Mean number of clusters per CRU (n cells and sheep as in Figure 2, **P = 0.015). (C) Number of individual RyRs per CRU (**P = 0.0015). (D) The area occupied by a CRU within minimal bounding polygon (see Supplementary material online, P = 0.14). (E) The fraction of CRU occupied by RyR was quantified as a ratio of RyR : total area per CRU, which is inversely related to the degree of CRU fragmentation (***P = 0.0001). (F) Quantification of the minimum separation of RyRs in the longitudinal direction (red arrow as an example of measured distances). (G) Histogram of the minimum separation in the longitudinal direction showing that in AF more sarcomeres have CRUs that are closer together in the longitudinal direction.
Figure 4
Figure 4
More frequent Ca2+ sparks, with slowed kinetics in permeabilized AF myocytes. (A) Examples of line scan images of spark recording in Ctrl (i) and AF (ii); rectangles highlight macrosparks. (B) Examples of two types of macrosparks in AF: multisite (i, from left box in Aii) and single site (ii, from the right box in Aii); macrospark incidence was increased in AF (iii). (C) Mean spark parameters show increase in spark frequency (i, ****P = 0.045), a reduced width (ii, ***P = 0.001), a longer spark duration (iii, ***P = 0.0001), and time to peak (TTP, iv, ***P = 0.004) in AF. Ncells = 26 and 31 in 5 Ctrl and 6 AF animals, respectively. (Di) Average linescans of all sparks in a typical Ctrl and AF cell (N = 179 and 258) with their temporal and spatial profiles from the central three pixels (lines on left indicate regions taken). Scale bar = 10 µm and 100 ms in (A); 5 µm and 50 ms in (B); 20 ms and 2 µm in (Di), 0.2 ΔF/F0 and 20 ms in (Dii); 0.2 ΔF/F0 and 2 µm in (Diii).
Figure 5
Figure 5
Computational modelling of intra-CRU RyR interaction. (A) Schematic of model for simulation: release from one large RyR cluster within the CRU can activate the smaller RyR cluster by the diffusion of released Ca2+ from the larger cluster (depicted by the red arrows); the 49 RyR large cluster is 200 nm edge to edge away from the 5 RyR cluster. (B) Simulated linescan image of total Ca2+ (i): A smaller, more prolonged release from the small cluster is visible, after activation by Ca2+ released from the main cluster; however, this is not visible on the simulated linescan F/F0 image (ii). (C) Spatial profiles of total Ca2+ (i) and F/F0 (ii) at different time points after peak release (inset). Cluster interaction is only evident as asymmetry in the total Ca2+ plot at −0.1 and −0.2 distances. (D) Probability of release from a small cluster being triggered (Ptrigger) as function of the distance from the larger site (i) and the corresponding delay of activation (ii). There is a high likelihood of activation with <2 ms delay if small clusters are ≤150 nm away from a larger one. (E) Schematic of model for simulation: synchronous release from small (5 RyR) clusters can activate a larger (25 RyR) cluster 100 nm away by the diffusion of released Ca2+ (red arrows). (F) Simulated linescan images of total Ca2+ (i) and resultant F/F0 (ii). (G) Spatial profiles of total Ca2+ (i) and F/F0 (ii) at times indicated after the peak of release. (H) Simulated probability of triggering a central cluster with increasing numbers of satellite RyR clusters. Dotted lines indicate experimentally observed numbers of satellites in Ctrl (black) and AF (red). Scale bars: (Bi and Fi): 200 nm, 5 ms; (Bii and Fii): 500 nm, 20 ms.
Figure 6
Figure 6
Simulation of neighbouring cluster activation during a macrospark. (A) Schematic of the model: four clusters, each with one central 25 RyR cluster and three clusters with 5 RyR, placed at variable edge-to-edge distances, from 400 to 700 nm. (B) Simulated linescan image of a macrospark event. Four clusters were placed 600 nm apart; the central release site from one was activated, releasing Ca2+ that diffused to raise Ca2+ local to the neighbouring site, triggering its release. Resultant total Ca2+(i) and F/F0 linescan images (ii) from this simulation are shown. (C) Spatial profiles of the ΔF/F0 and total Ca2+ are depicted at the timescales indicated. (D) Probability of propagation between adjacent clusters, analogous to the probability of macrospark formation, as a function of the longitudinal separation between them. Scale bars in B: 2 µm vertical (i and ii), 5 ms (i) and 20 ms (ii) horizontal.

References

    1. Wakili R, Voigt N, Kaab S, Dobrev D, Nattel S. Recent advances in the molecular pathophysiology of atrial fibrillation. J Clin Invest 2011;121:2955–2968. - PMC - PubMed
    1. Camm AJ, Lip GY, De CR, Savelieva I, Atar D, Hohnloser SH, Hindricks G, Kirchhof P. 2012 focused update of the ESC Guidelines for the management of atrial fibrillation. Eur Heart J 2012;33:2719–2747. - PubMed
    1. Dobrev D, Carlsson L, Nattel S. Novel molecular targets for atrial fibrillation therapy. Nat Rev Drug Discov 2012;11:275–291. - PubMed
    1. Neef S, Dybkova N, Sossalla S, Ort KR, Fluschnik N, Neumann K, Seipelt R, Schondube FA, Hasenfuss G, Maier LS. CaMKII-dependent diastolic SR Ca2+ leak and elevated diastolic Ca2+ levels in right atrial myocardium of patients with atrial fibrillation. Circ Res 2010;106:1134–1144. - PubMed
    1. Voigt N, Li N, Wang Q, Wang W, Trafford AW, Abu-Taha I, Sun Q, Wieland T, Ravens U, Nattel S, Wehrens XH, Dobrev D. Enhanced sarcoplasmic reticulum Ca2+ leak and increased Na+-Ca2+ exchanger function underlie delayed afterdepolarizations in patients with chronic atrial fibrillation. Circulation 2012;125:2059–2070. - PMC - PubMed

Publication types

MeSH terms

Substances