. 2015 Oct 21;35(42):14148-59.
doi: 10.1523/JNEUROSCI.1211-15.2015.

There Is a "U" in Clutter: Evidence for Robust Sparse Codes Underlying Clutter Tolerance in Human Vision

Affiliations

There Is a "U" in Clutter: Evidence for Robust Sparse Codes Underlying Clutter Tolerance in Human Vision

Patrick H Cox et al. J Neurosci. .

Abstract

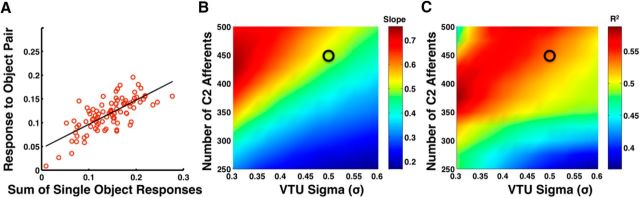
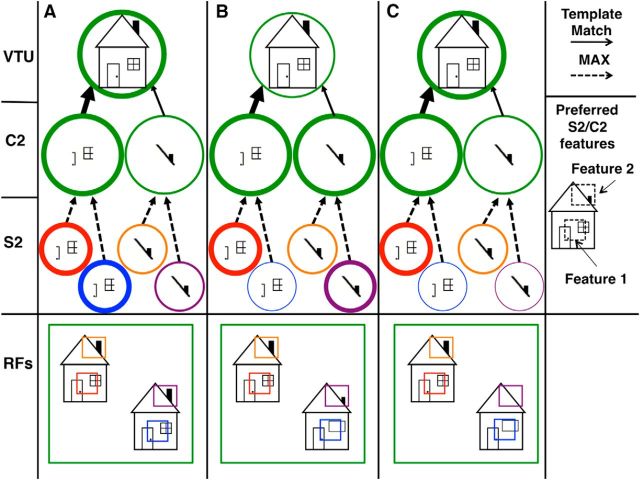
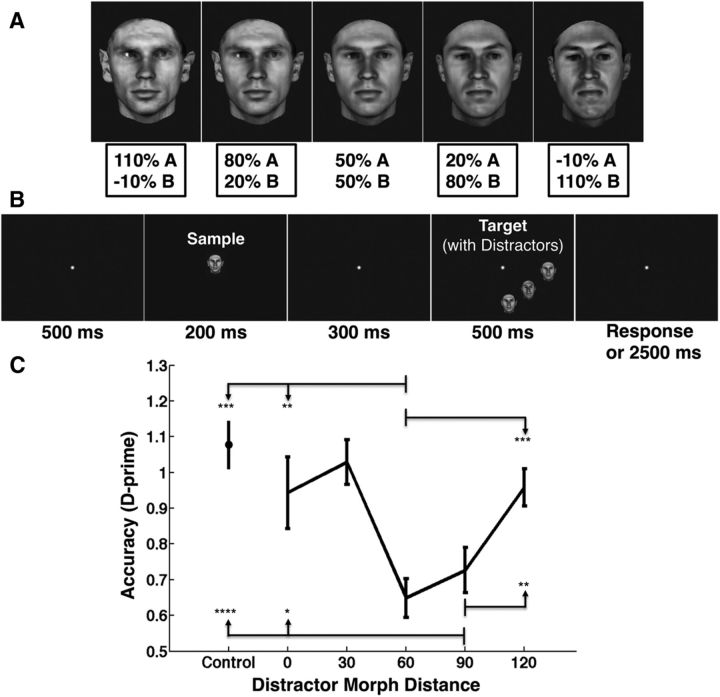
The ability to recognize objects in clutter is crucial for human vision, yet the underlying neural computations remain poorly understood. Previous single-unit electrophysiology recordings in inferotemporal cortex in monkeys and fMRI studies of object-selective cortex in humans have shown that the responses to pairs of objects can sometimes be well described as a weighted average of the responses to the constituent objects. Yet, from a computational standpoint, it is not clear how the challenge of object recognition in clutter can be solved if downstream areas must disentangle the identity of an unknown number of individual objects from the confounded average neuronal responses. An alternative idea is that recognition is based on a subpopulation of neurons that are robust to clutter, i.e., that do not show response averaging, but rather robust object-selective responses in the presence of clutter. Here we show that simulations using the HMAX model of object recognition in cortex can fit the aforementioned single-unit and fMRI data, showing that the averaging-like responses can be understood as the result of responses of object-selective neurons to suboptimal stimuli. Moreover, the model shows how object recognition can be achieved by a sparse readout of neurons whose selectivity is robust to clutter. Finally, the model provides a novel prediction about human object recognition performance, namely, that target recognition ability should show a U-shaped dependency on the similarity of simultaneously presented clutter objects. This prediction is confirmed experimentally, supporting a simple, unifying model of how the brain performs object recognition in clutter.

Significance statement: The neural mechanisms underlying object recognition in cluttered scenes (i.e., containing more than one object) remain poorly understood. Studies have suggested that neural responses to multiple objects correspond to an average of the responses to the constituent objects. Yet, it is unclear how the identities of an unknown number of objects could be disentangled from a confounded average response. Here, we use a popular computational biological vision model to show that averaging-like responses can result from responses of clutter-tolerant neurons to suboptimal stimuli. The model also provides a novel prediction, that human detection ability should show a U-shaped dependency on target-clutter similarity, which is confirmed experimentally, supporting a simple, unifying account of how the brain performs object recognition in clutter.

Keywords: HMAX; clutter; sparse coding; vision.


Figures

Figure 1.
Figure 1.
The HMAX model of object recognition in cortex. Feature specificity and invariance to translation and scale are gradually built up by a hierarchy of “S” (performing a “template match” operation, solid red lines) and “C” layers (performing a MAX-pooling operation, dashed blue lines), respectively, leading to VTUs that show shape-tuning and invariance properties in quantitative agreement with physiological data from monkey IT. These units can then provide input to task-specific circuits located in higher areas, e.g., prefrontal cortex. This diagram depicts only a few sample units at each level for illustration (for details, see Materials and Methods).
Figure 2.
Figure 2.
Accounting for human fMRI data. A, One example plot showing the linear relationship between the average model VTU population response to object pairs and the sum of the average population responses to the individual objects from that pair (see Results). Fitting with linear regression gives a line with a slope of 0.51 and an r2 value of 0.53. B, The slopes of the best-fit lines for a range of different VTU selectivity parameter sets. In the simulation data shown, the number of C2 afferents to each VTU was varied from 250 to 500 in increments of 25 and VTU σ was varied from 0.3 to 0.6 in increments of 0.025 to simulate different levels of neuronal selectivity, with selectivity increasing for larger numbers of C2 afferents and smaller values of σ (see Materials and Methods). C, The r2 values corresponding to the slopes shown in B. The black circles in B and C indicate the location of the parameter set used for the simulations in A (corresponding to 450 C2 afferents and a VTU σ of 0.5), and a large subset of the tested parameter space shows similar slopes and r2 values.
Figure 3.
Figure 3.
Accounting for monkey electrophysiology data. A, Distribution of CT values of single-unit IT recordings from Zoccolan et al.'s (2007) Figure 8. The black arrow indicates the mean CT values for the entire population (mean CT, 0.74). B, Results from our simulations. Results shown used the same parameter set as in Figure 2A, which provided a good fit for the fMRI data. The black arrow indicates the mean CT value from the simulated population of 60 VTUs (mean CT of model VTUs, 0.71). Notice that the CT values from the model VTUs cover a range of CT values that is quite similar to the electrophysiological single-unit recordings in A, with similar means. In both panels, the dashed lines indicate the CT values corresponding to an averaging rule (CT, 0.5) and complete clutter invariance (CCI; CT, 1.0).
Figure 4.
Figure 4.
The predicted U-shaped effect of clutter on neuronal responses of object-tuned units in the visual processing hierarchy. This diagram demonstrates the effects of clutter objects of varying levels of dissimilarity on a VTUs response to its preferred object. A–C, Highly similar or identical (A) or highly dissimilar (C) clutter objects produce little to no interference, but at an intermediate level of clutter similarity (B), clutter interference is maximal. This is an extremely simplified example containing only two feature-tuned C2 units, whereas actual simulations use on the order of hundreds of intermediate features (Fig. 2). The image shown inside each unit is that unit's preferred stimulus: the VTU prefers a particular house stimulus with a medium-sized chimney and paned window to the right of the door, whereas the C2 afferents respond to different house-specific features (one tuned to a door/paned window feature and one tuned to a small chimney feature). The unit activation level is represented by outline thickness, with thicker outlines representing higher activation. The dotted arrows represent a MAX-pooling function, and the solid lines represent a template-matching function (see Fig. 1), with the thickness of the arrow corresponding to the preferred activation level of the afferent (when the thickness of the arrow matches the thickness of the unit at the tail of the arrow, the response of the downstream unit will be highest). The bottom row of each panel depicts the visual stimulus and parts of the stimulus covered by the receptive field (RF) of each unit, with each units' outline color corresponding to the color of its outlined RF in the bottom row. The VTU's preferred object is always shown in the upper left of the visual input image, together with a simultaneously presented clutter object (the house in the lower right). A, When two copies of the preferred object are presented in the VTU's RF, the S2-level feature-tuned units tuned to the same feature (but receiving separate input from the two copies of the house) activate identically. Taking the maximum of the two at the C2 level will therefore lead to the same C2 response as when the preferred object is presented by itself, thus causing no interference at the VTU level (strong response, thick outline). B, When the preferred object is presented together with a similar clutter object, there are two possible scenarios: (1) the clutter object could activate a particular S2 feature-tuned unit less strongly than the target (as in the left, door/paned window feature); in this case the corresponding C2 unit due to its MAX integration will show the same activation as in the no-clutter case, i.e., there will be no interference; (2) the clutter object could activate the S2 feature tuned unit more strongly (as in the right, small chimney feature), leading to a higher C2 unit activation as a result of the MAX-pooling operation, thus causing interference (shown by the thinner circle at the VTU level) because the afferent activation pattern to the VTU unit is now suboptimal. Note the mismatch between actual C2 activation and the VTU's preferred activation here, demonstrated by the thickness of the circle depicting the activation for the C2 small chimney feature and the preferred activation for the house VTU indicated by the thickness of the arrow between the C2 small chimney feature and the house VTU: although the particular chimney causes a strong activation of the small chimney feature (thick circle outline), this is suboptimal for the particular house VTU whose preferred house stimulus activates the chimney feature more weakly due to its medium-sized chimney (indicated by the thinner arrow from the chimney feature to house VTU). C, A clutter object that is very dissimilar to the preferred object activates the relevant features only weakly, making it unlikely that activation from the clutter object will interfere at the C2 MAX-pooling level. This leads to the behavioral prediction that recognition ability should show a U-shaped curve as a function of target–distractor similarity.
Figure 5.
Figure 5.
Predicting the interfering effect of clutter at the behavioral level. A, An example a “morph line” between a pair of face prototypes (shown at the far left and right, respectively), created using a photorealistic morphing system (Blanz and Vetter, 1999). The relative contribution of each face prototype changes smoothly along the line. For example, the third face from the left (the second morph) is a mixture of 60% of the face on the far left and 40% of the face on the far right. B, Example of the target-plus-distractor clutter test stimuli used in the model simulations. Each test stimulus contained a target prototype face in the upper left-hand corner (in this case, prototype face A from the morph line in A) and a distractor face of varying similarity to the target in the bottom right-hand corner (in this case, the distractor is 20% face A and 80% face B, or a morph distance of 80%). C, An example (for one parameter set) of the predicted amount of interference as a function of clutter–target dissimilarity, showing a significant decrease in predicted interference once the distractor face became dissimilar enough. *p < 0.05; p < 0.1 (paired t test). The neural representation of a target face was defined as a sparse activation pattern over the set of face units with preferred face stimuli most similar to the target face (see Materials and Methods, Model predictions for human behavior). Interference was calculated as the Euclidean distances between these face units' responses to the target in isolation versus the response pattern caused by the target-plus-distractor images. Data shown are averages over 10 morph lines (same morphs as used by Jiang et al., 2006). Error bars indicate SEM. Distractor faces for a particular target face were chosen to lie at different distances along the morph line (0, 20,, 100%, with 0% corresponding to two copies of the target face and 100% corresponding to the target face along with another prototype face), resulting in six different conditions. For this parameter set, maximal interference is found for distractors at 60% distance to the target face. D, Group data for all the parameter sets tested with the HMAX model. The histogram depicts the counts of the locations of the peaks in the clutter interference curves (like the one shown in C) for each parameter set.
Figure 6.
Figure 6.
Testing behavioral performance for target detection in clutter. A, Face stimuli were created for the behavior experiment by morphing between and beyond two prototype face stimuli in 30% steps (Blanz and Vetter, 1999). The four stimuli with the box around the labels were possible sample/target stimuli, and the 50% A/50% B face stimulus was used only as a distractor. For details, see Materials and Methods. B, Experimental paradigm. Subjects (N = 12) were asked to detect whether a briefly presented “sample” face was the same as or different from a “target” face that was presented in isolation (control condition, not pictured) or surrounded by distractor faces of varying similarity to the target face. For details, see Materials and Methods. The trial shown here is a “different” trial, with a distractor morph distance of 60% (the “sample” is the 80% A/20% B face in A, the “target” is the −10% A/110% B face in A, and the “distractors” are the 50% A/50% B face in A). C, Behavioral performance for each target face/distractor face similarity condition tested. As predicted, there is an initial drop in performance as distractor dissimilarity increases, followed by a subsequent rebound in performance as the distractor faces become more dissimilar (comparisons are between the conditions at the tail of each arrow and the arrowhead, with significance demarcated at the arrowhead; *p < 0.05, **p < 0.005, ***p < 0.0005, ****p < 0.00005). Accuracy is measured here using d′, though similar results were found by analyzing the percentage of correct responses. Error bars show SEM.

Similar articles

Cited by

References

    1. Afraz SR, Kiani R, Esteky H. Microstimulation of inferotemporal cortex influences face categorization. Nature. 2006;442:692–695. doi: 10.1038/nature04982. - DOI - PubMed
    1. Agam Y, Liu H, Papanastassiou A, Buia C, Golby AJ, Madsen JR, Kreiman G. Robust selectivity to two-object images in human visual cortex. Curr Biol. 2010;20:872–879. doi: 10.1016/j.cub.2010.03.050. - DOI - PMC - PubMed
    1. Andriessen JJ, Bouma H. Eccentric vision: adverse interactions between line segments. Vision Res. 1976;16:71–78. doi: 10.1016/0042-6989(76)90078-X. - DOI - PubMed
    1. Baeck A, Wagemans J, Op de Beeck HP. The distributed representation of random and meaningful object pairs in human occipitotemporal cortex: the weighted average as a general rule. Neuroimage. 2013;70:37–47. doi: 10.1016/j.neuroimage.2012.12.023. - DOI - PubMed
    1. Balas B, Nakano L, Rosenholtz R. A summary-statistic representation in peripheral vision explains visual crowding. J Vis. 2009;9(12):13, 1–18. doi: 10.1167/9.12.13. - DOI - PMC - PubMed

Publication types

LinkOut - more resources