. 2015 Oct 21;35(42):14172-82.
doi: 10.1523/JNEUROSCI.1911-15.2015.

A Post-Docking Role of Synaptotagmin 1-C2B Domain Bottom Residues R398/399 in Mouse Chromaffin Cells

Affiliations

A Post-Docking Role of Synaptotagmin 1-C2B Domain Bottom Residues R398/399 in Mouse Chromaffin Cells

Girish H Kedar et al. J Neurosci. .

Abstract

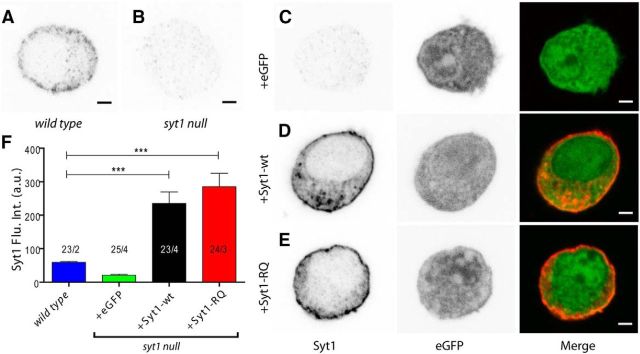
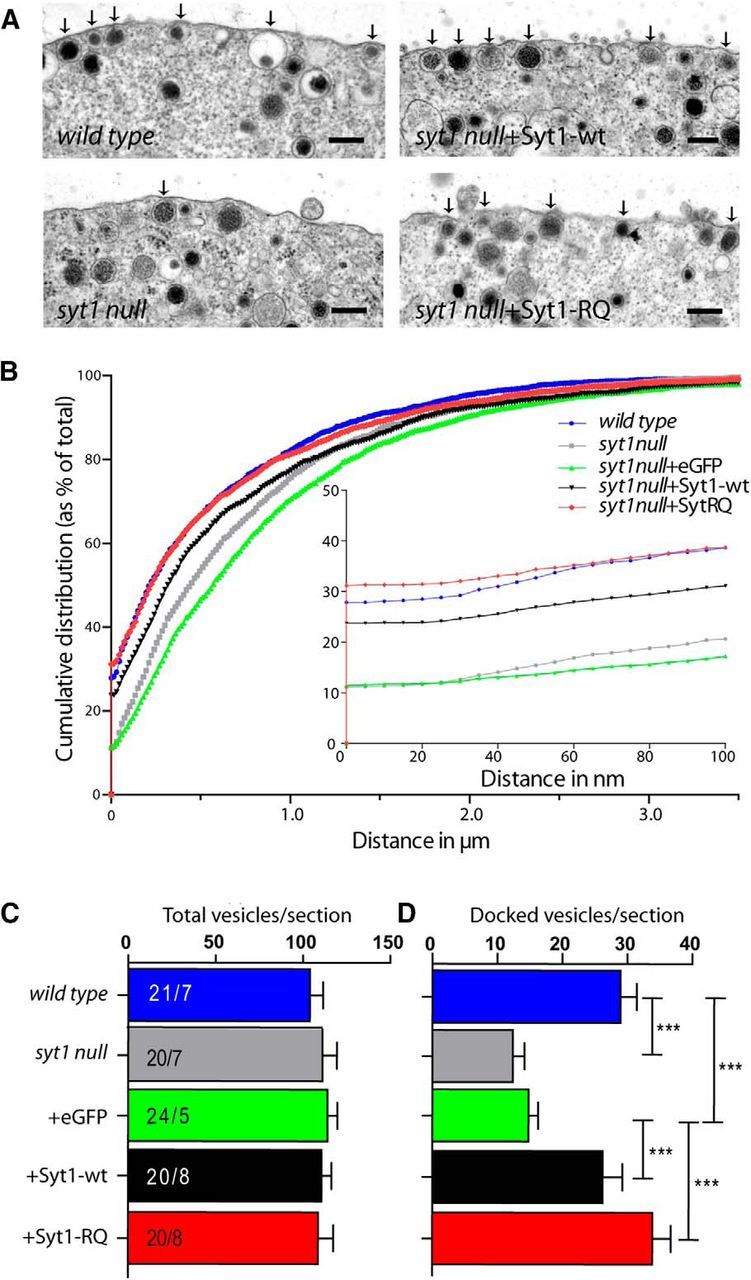
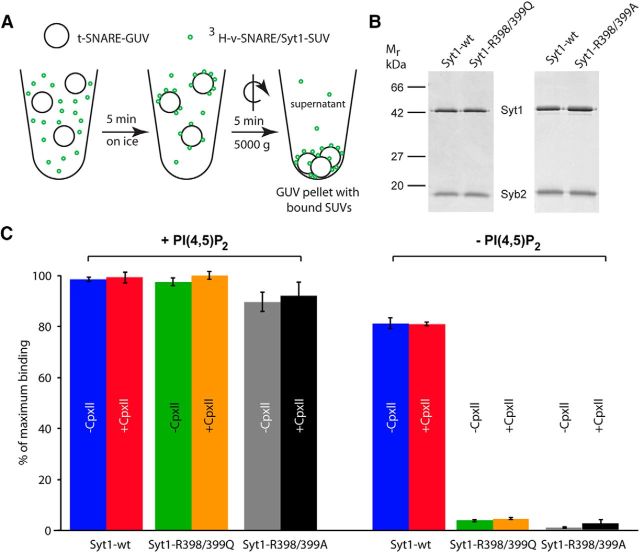
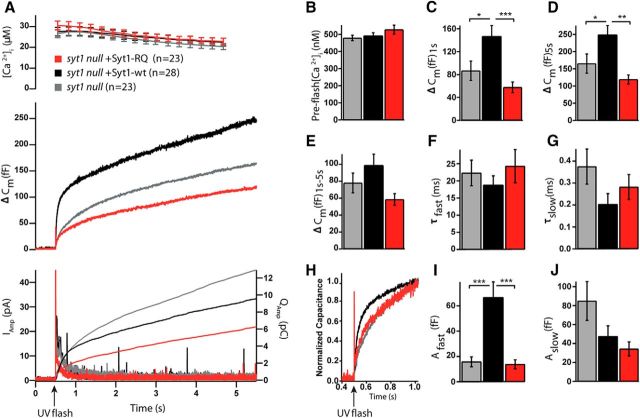
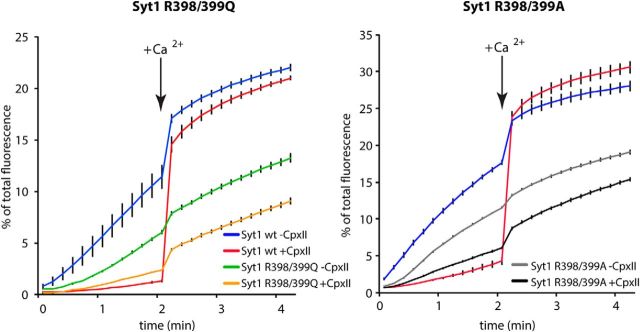
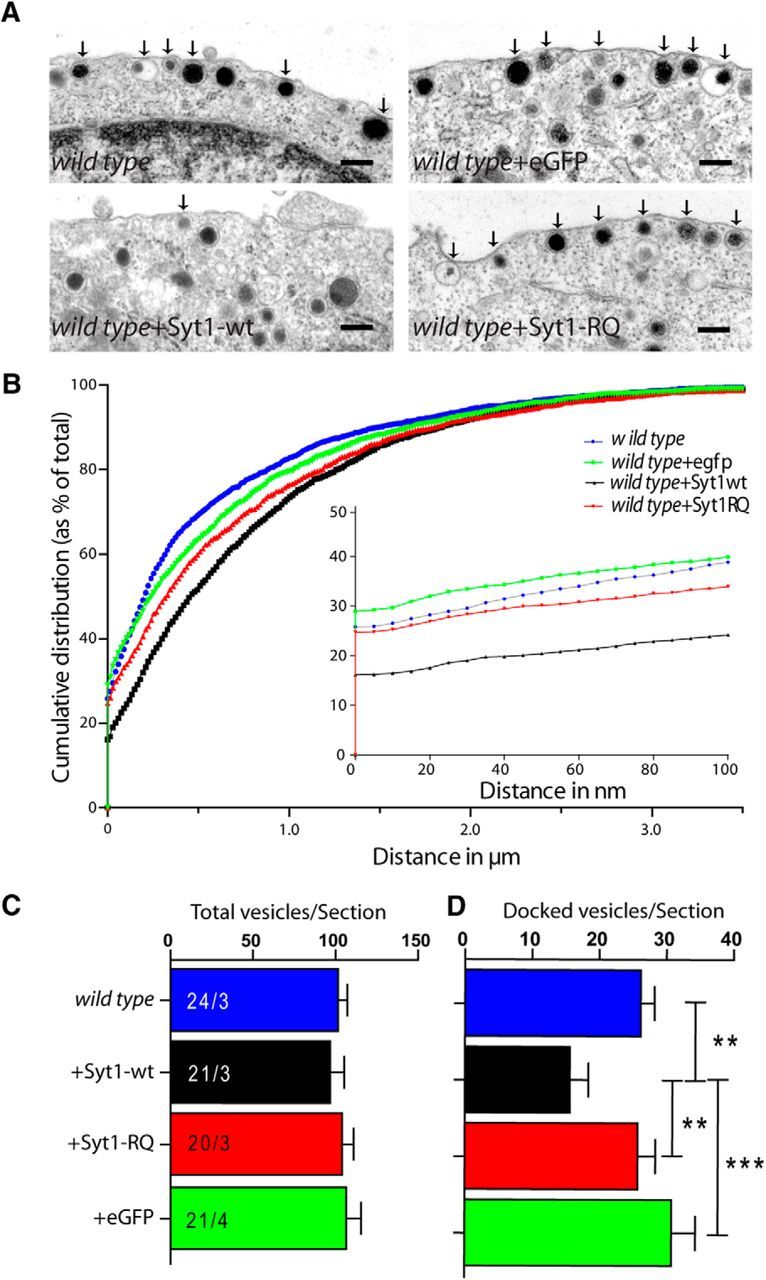
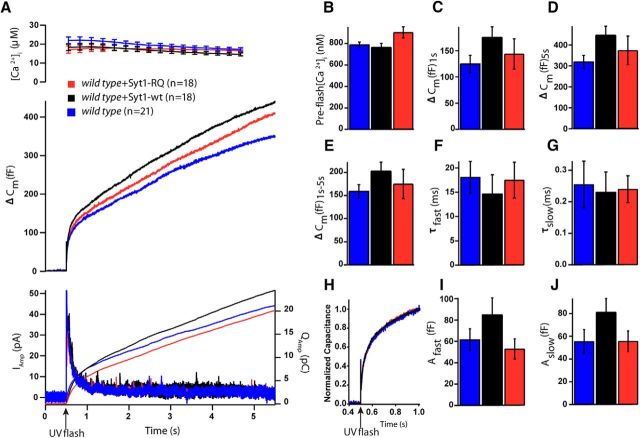
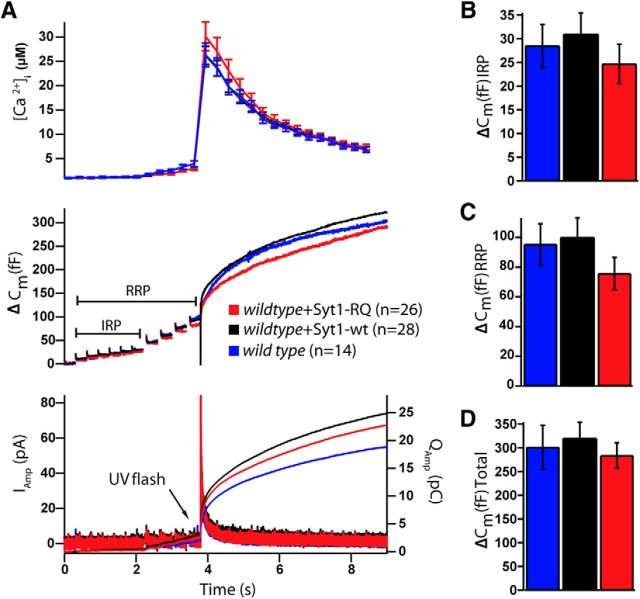
Synaptotagmin-1 (Syt1) is the principal Ca(2+) sensor for vesicle fusion and is also essential for vesicle docking in chromaffin cells. Docking depends on interactions of the Syt1-C2B domain with the t-SNARE SNAP25/Syntaxin1 complex and/or plasma membrane phospholipids. Here, we investigated the role of the positively charged "bottom" region of the C2B domain, proposed to help crosslink membranes, in vesicle docking and secretion in mouse chromaffin cells and in cell-free assays. We expressed a double mutation shown previously to interfere with lipid mixing between proteoliposomes and with synaptic transmission, Syt1-R398/399Q (RQ), in syt1 null mutant cells. Ultrastructural morphometry revealed that Syt1-RQ fully restored the docking defect observed previously in syt1 null mutant cells, similar to wild type Syt1 (Syt1-wt). Small unilamellar lipid vesicles (SUVs) that contained the v-SNARE Synaptobrevin2 and Syt1-R398/399Q also docked to t-SNARE-containing giant vesicles (GUVs), similar to Syt1-wt. However, unlike Syt1-wt, Syt1-RQ-induced docking was strictly PI(4,5)P2-dependent. Unlike docking, neither synchronized secretion in chromaffin cells nor Ca(2+)-triggered SUV-GUV fusion was restored by the Syt1 mutants. Finally, overexpressing the RQ-mutant in wild type cells produced no effect on either docking or secretion. We conclude that the positively charged bottom region in the C2B domain--and, by inference, Syt1-mediated membrane crosslinking--is required for triggering fusion, but not for docking. Secretory vesicles dock by multiple, PI(4,5)P2-dependent and PI(4,5)P2-independent mechanisms. The R398/399 mutations selectively disrupt the latter and hereby help to discriminate protein regions involved in different aspects of Syt1 function in docking and fusion.

Significance statement: This study provides new insights in how the two opposite sides of the C2B domain of Synaptotagmin-1 participate in secretory vesicle fusion, and in more upstream steps, especially vesicle docking. We show that the "bottom" surface of the C2B domain is required for triggering fusion, but not for docking. Synaptotagmin-1 promotes docking by multiple, PI(4,5)P2-dependent and PI(4,5)P2-independent mechanisms. Mutations in the C2B bottom surface (R398/399) selectively disrupt the latter. These mutations help to discriminate protein regions involved in different aspects of Synaptotagmin-1 function in docking and fusion.

Keywords: mouse chromaffin cells; patch-clamp technique; synaptotagmin-1; ultrastructural analysis.


Conflict of interest statement

The authors declare no conflict of interest.

Figures

Figure 1.
Figure 1.
SFV transfection leads to overexpression of Syt1-wt and the Syt1-RQ mutant. A, B, Syt1 is located near the plasma membrane in wild type chromaffin cells (A) and is absent in syt1 null cells (B). C–E, eGFP overexpression does not change Syt1 expression in the syt1 null cell (C), whereas Syt1-wt (D) and Syt1-RQ mutant (E) transfection result in 4–5× overexpression (OE). Scale bars: 2 μm. F, Quantification of Syt1 levels by multilevel analysis. Between 3 and 14 cells were collected from two to four embryos per condition, and overall cell numbers and embryo numbers are annotated. ***p ≤ 0.001. Error bars indicate SEM. Flu. Int., Fluorescence intensity.
Figure 2.
Figure 2.
Syt1-RQ mutant rescues docking in syt1 null cells. A, Ultrastructural images of different noninfected and infected conditions on the syt1 null cell background. Arrows mark docked vesicles. Scale bars: 200 nm. B, Normalized cumulative distribution of vesicles as a function of the distance from the plasma membrane. Inset, Distance in the range of 0–100 nm from membrane. C, D, Number of total (C) and docked (D) vesicles per section showing no difference in docking for Syt1-RQ mutant. ***p ≤ 0.001 by multilevel analysis (between 1–8 cells were collected from 5–8 embryos per condition; overall cell numbers and embryo numbers are annotated in C). Error bars indicate SEM.
Figure 3.
Figure 3.
Syt1–R398/399Q- and Syt1–R398/399A-dependent vesicle docking requires the presence of PI(4,5)P2 in a reconstituted SUV–GUV docking assay. A, Scheme of vesicle docking assay. t-SNARE-GUVs (28 nmol lipid, 28 pmol Syntaxin1/SNAP-25) lacking or containing 2% PI(4,5)P2 were mixed with 3H-labeled v-SNARE/Syt1-SUVs (5 nmol lipid, 16.6 pmol Synaptobrevin2, 6.2 pmol Syt1), containing either Syt1-wt or Syt1–R398/399Q or Syt1-RA in the presence and absence of 6 μm Complexin II (CpxII). Samples were incubated in a final volume of 100 μl for 5 min on ice to allow docking, followed by centrifugation at 5000 × g for 5 min to reisolate GUVs. B, Reconstituted SUVs, containing Synaptobrevin2 (Syb2) and either Syt1-wt or Syt1–R398/399Q or Syt1-RA, were analyzed by SDS-PAGE and Coomassie blue staining. C, 3H-labeled SUVs bound to GUVs in the pellet were quantified and normalized to maximum binding. Error bars indicate SEM (n = 3).
Figure 4.
Figure 4.
Syt1-RQ mutant impaired secretion in syt1 null cells. A, Mean membrane capacitance and Ca2+ measurements of syt1 null (gray) with Syt1-wt overexpression (black) and Syt1-RQ mutant (red). B, Quantification of preflash [Ca2+]. C, Burst size was higher in Syt1-wt overexpression than Syt1-RQ overexpression and syt1 null (ΔCm at 1 s; Kruskal–Wallis test, p < 0.001; result of pairwise post-tests, syt1 null vs Syt1-wt overexpression, p = 0.016; Syt1-wt overexpression vs Syt1-RQ, p < 0.001). D, The same was true of total release size (ΔCm at 5.5 s, Kruskal–Wallis test, p = 0.004; result of pairwise post-tests, syt1 null vs Syt1-wt overexpression, p = 0.035; Syt1-wt overexpression vs Syt1-RQ, p = 0.005). E, For sustained release, the difference was almost, but not quite, significant (ΔCm at 5.5–1 s; Kruskal–Wallis test, p = 0.051). F, G, I, J, Fitting individual capacitance traces with a sum of exponentials allowed separating the amplitude and time constant of fast burst secretion from the amplitude and time constant of slow burst secretion. Only the amplitude of the fast burst (Afast) was significantly different between groups (Kruskal–Wallis test, p < 0.001; result of pairwise post-tests, syt1 null vs Syt1-wt overexpression, p < 0.001; Syt1-wt overexpression vs Syt1-RQ, p < 0.001). H, Scaled version of the mean capacitance traces in A clearly show the fast component in the Syt1-wt overexpression, which is missing from syt1 null and Syt1-RQ overexpression. Error bars indicate SEM.
Figure 5.
Figure 5.
Syt1-RQ and Syt1-RA mutants fail to promote Ca2+-triggered lipid mixing in a reconstituted SUV–GUV fusion assay. t-SNARE-GUVs (14 nmol lipid, 14 pmol Syntaxin1/SNAP25) were mixed with 3H-labeled v-SNARE-SUVs (2.5 nmol lipid, 8.3 pmol Synaptobrevin2, 3.1 pmol Syt1) containing either Syt1-wt or Syt1–R398/399Q or Syt1-RA in the presence and absence of 6 μm CpxII in a final volume of 100 μl. The increase of Atto488 fluorescence was monitored. After 2 min at 37°C, Ca2+ was added to a final concentration of 100 μm and the measurement continued for another 2 min. Values were normalized to the maximum fluorescent signal after detergent lysis. Error bars indicate SEM. n = 3.
Figure 6.
Figure 6.
Syt1-wt overexpression in wild type chromaffin cells reduces docking. A, Ultrastructural images of different noninfected and infected conditions on the wild-type cell background. Scale bars: 200 nm. Arrows mark docked vesicles. B, Normalized cumulative distribution of vesicles as a function of the distance from the plasma membrane. Inset, The distance range of 0–100 nm from the membrane. C, D, Numbers of total (C) and docked (D) vesicles per section showing a significant reduction in docking in Syt1-wt-overexpressing wild-type cells. Error bars indicate SEM.
Figure 7.
Figure 7.
Overexpression of the Syt1-RQ mutant does not alter secretion in wild type chromaffin cells. A, Mean membrane capacitance, Ca2+, and amperometry measurements of wild-type (blue), with Syt1-wt overexpression (black) and Syt1-RQ mutant (red). B, Quantification of preflash [Ca2+]. C, The burst size was slightly higher in Syt1-wt overexpression than in Syt1-RQ overexpression and syt1 null, but this was not significant (Kruskal–Wallis, p = 0.149). D, The total release (ΔCm at 5.5 s) was unchanged between conditions. E, No difference was detected for sustained release (ΔCm at 5.5–1 s). F, G, I, J, Fitting individual capacitance traces with a sum of exponentials allowed separating the amplitude and time constant of fast burst secretion from the amplitude and time constant of slow burst secretion. None of the parameters were significantly different between groups. H, Scaled version of the mean capacitance traces in A clearly show similar kinetics in the three groups. Overexpression levels of Syt1 constructs were similar (see Fig. 1). Error bars indicate SEM.
Figure 8.
Figure 8.
Syt1-RQ mutant overexpression in wild type chromaffin cells does not affect the IRP size. A, Mean membrane capacitance, Ca2+, and amperometry measurements of wild-type cells (blue), Syt1-wt overexpression (black), and Syt1-RQ mutant (red) overexpression in wild-type cells. B, There was no difference in IRP size (capacitance increase elicited by the first 6 brief 10 ms depolarizations) between conditions. C, D, RRP (capacitance increase elicited by the 6 10 ms depolarizations, and the 4 100 ms depolarizations) and total membrane capacitance after a Ca2+ uncaging flash were not significantly different in any condition. Error bars indicate SEM.

Similar articles

Cited by

References

    1. Aarts E, Verhage M, Veenvliet JV, Dolan CV, van der Sluis S. A solution to dependency: using multilevel analysis to accommodate nested data. Nat Neurosci. 2014;17:491–496. doi: 10.1038/nn.3648. - DOI - PubMed
    1. Alvarez YD, Marengo FD. The immediately releasable vesicle pool: highly coupled secretion in chromaffin and other neuroendocrine cells. J Neurochem. 2011;116:155–163. doi: 10.1111/j.1471-4159.2010.07108.x. - DOI - PubMed
    1. Araç D, Chen X, Khant HA, Ubach J, Ludtke SJ, Kikkawa M, Johnson AE, Chiu W, Südhof TC, Rizo J. Close membrane-membrane proximity induced by Ca(2+)-dependent multivalent binding of synaptotagmin-1 to phospholipids. Nat Struct Mol Biol. 2006;13:209–217. doi: 10.1038/nsmb1056. - DOI - PubMed
    1. Bruns D. Detection of transmitter release with carbon fiber electrodes. Methods. 2004;33:312–321. doi: 10.1016/j.ymeth.2004.01.004. - DOI - PubMed
    1. Chapman ER. How does synaptotagmin trigger neurotransmitter release? Annu Rev Biochem. 2008;77:615–641. doi: 10.1146/annurev.biochem.77.062005.101135. - DOI - PubMed

Publication types

MeSH terms