

Evaluating the Use of Antibody Variable Region (Fv) Charge as a Risk Assessment Tool for Predicting Typical Cynomolgus Monkey Pharmacokinetics
- PMID: 26491012
- PMCID: PMC4705991
- DOI: 10.1074/jbc.M115.692434
Evaluating the Use of Antibody Variable Region (Fv) Charge as a Risk Assessment Tool for Predicting Typical Cynomolgus Monkey Pharmacokinetics
Abstract
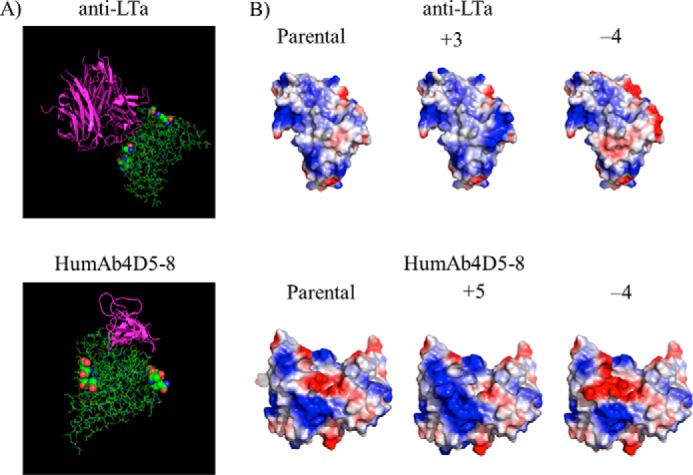
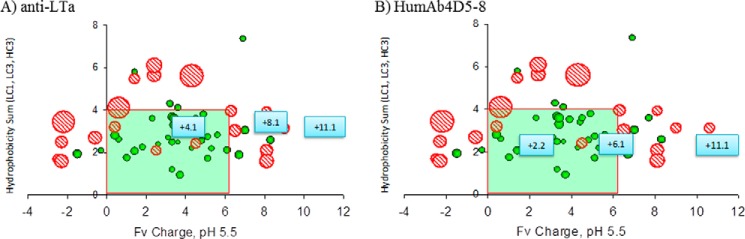
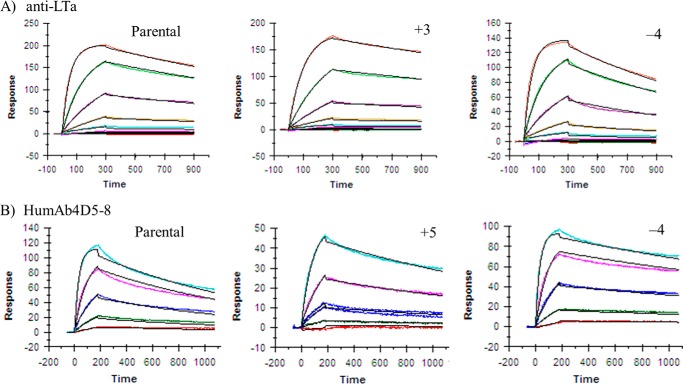
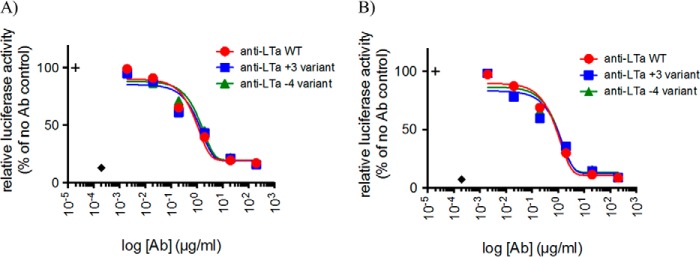
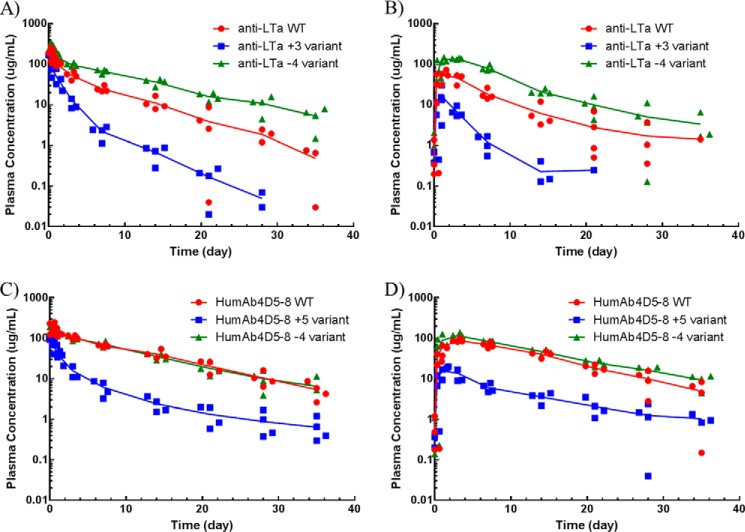
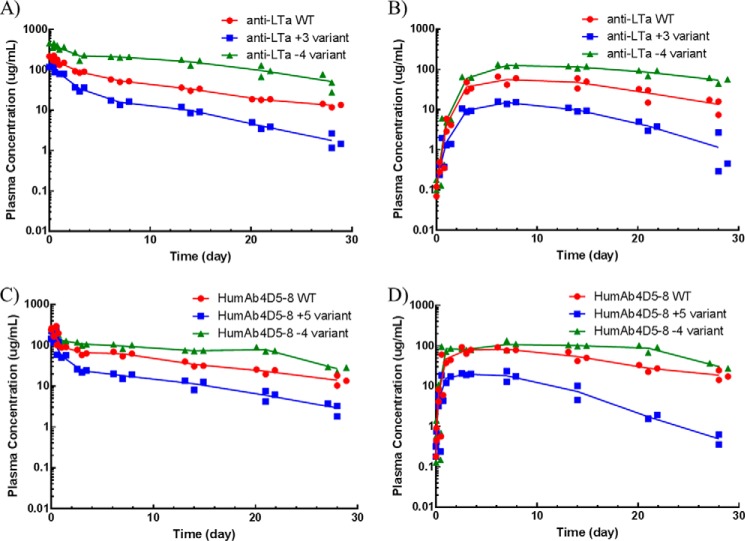
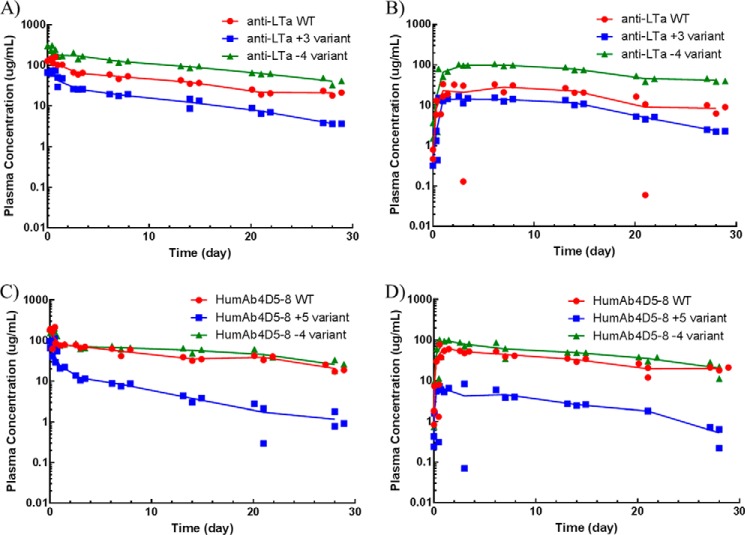
The pharmacokinetic (PK) behavior of monoclonal antibodies in cynomolgus monkeys (cynos) is generally translatable to that in humans. Unfortunately, about 39% of the antibodies evaluated for PKs in cynos have fast nonspecific (or non-target-mediated) clearance (in-house data). An empirical model relating variable region (Fv) charge and hydrophobicity to cyno nonspecific clearance was developed to gauge the risk an antibody would have for fast nonspecific clearance in the monkey. The purpose of this study was to evaluate the predictability of this empirical model on cyno nonspecific clearance with antibodies specifically engineered to have either high or low Fv charge. These amino acid changes were made in the Fv region of two test antibodies, humAb4D5-8 and anti-lymphotoxin α. The humAb4D5-8 has a typical nonspecific clearance in cynos, and by making it more positively charged, the antibody acquires fast nonspecific clearance, and making it less positively charged did not impact its clearance. Anti-lymphotoxin α has fast nonspecific clearance in cynos, and making it more positively charged caused it to clear even faster, whereas making it less positively charged caused it to clear slower and within the typical range. These trends in clearance were also observed in two other preclinical species, mice and rats. The effect of modifying Fv charge on subcutaneous bioavailability was also examined, and in general bioavailability was inversely related to the direction of the Fv charge change. Thus, modifying Fv charge appears to impact antibody PKs, and the changes tended to correlate with those predicted by the empirical model.
Keywords: antibody; antibody engineering; charge; clearance; homology modeling; mutant; pharmacokinetics.
© 2015 by The American Society for Biochemistry and Molecular Biology, Inc.
Figures
Similar articles
-
Framework selection can influence pharmacokinetics of a humanized therapeutic antibody through differences in molecule charge.MAbs. 2014;6(5):1255-64. doi: 10.4161/mabs.29809. Epub 2014 Oct 30. MAbs. 2014. PMID: 25517310 Free PMC article.
-
Preclinical pharmacokinetics of MEHD7945A, a novel EGFR/HER3 dual-action antibody, and prediction of its human pharmacokinetics and efficacious clinical dose.Cancer Chemother Pharmacol. 2012 Apr;69(4):1063-9. doi: 10.1007/s00280-011-1806-6. Epub 2011 Dec 28. Cancer Chemother Pharmacol. 2012. PMID: 22203367
-
Pharmacokinetics and biodistribution of genetically-engineered antibodies.Q J Nucl Med. 1998 Dec;42(4):225-41. Q J Nucl Med. 1998. PMID: 9973838 Review.
-
Linear pharmacokinetic parameters for monoclonal antibodies are similar within a species and across different pharmacological targets: A comparison between human, cynomolgus monkey and hFcRn Tg32 transgenic mouse using a population-modeling approach.MAbs. 2018 Jul;10(5):751-764. doi: 10.1080/19420862.2018.1462429. Epub 2018 May 14. MAbs. 2018. PMID: 29634430 Free PMC article.
-
Medical applications of single-chain antibodies.Int Rev Immunol. 1993;10(2-3):195-217. doi: 10.3109/08830189309061696. Int Rev Immunol. 1993. PMID: 8360586 Review.
Cited by
-
Monoclonal Antibody Pharmacokinetics in Cynomolgus Monkeys Following Subcutaneous Administration: Physiologically Based Model Predictions from Physiochemical Properties.AAPS J. 2022 Dec 1;25(1):5. doi: 10.1208/s12248-022-00772-4. AAPS J. 2022. PMID: 36456779
-
Blueprint for antibody biologics developability.MAbs. 2023 Jan-Dec;15(1):2185924. doi: 10.1080/19420862.2023.2185924. MAbs. 2023. PMID: 36880643 Free PMC article. Review.
-
Development of in silico models to predict viscosity and mouse clearance using a comprehensive analytical data set collected on 83 scaffold-consistent monoclonal antibodies.MAbs. 2023 Jan-Dec;15(1):2256745. doi: 10.1080/19420862.2023.2256745. MAbs. 2023. PMID: 37698932 Free PMC article.
-
Nature-inspired design and evolution of anti-amyloid antibodies.J Biol Chem. 2019 May 24;294(21):8438-8451. doi: 10.1074/jbc.RA118.004731. Epub 2019 Mar 27. J Biol Chem. 2019. PMID: 30918024 Free PMC article.
-
Establishing in vitro in vivo correlations to screen monoclonal antibodies for physicochemical properties related to favorable human pharmacokinetics.MAbs. 2018 Feb/Mar;10(2):244-255. doi: 10.1080/19420862.2017.1417718. Epub 2018 Jan 29. MAbs. 2018. PMID: 29271699 Free PMC article.
References
-
- Hay M., Thomas D. W., Craighead J. L., Economides C., and Rosenthal J. (2014) Clinical development success rates for investigational drugs. Nat. Biotechnol. 32, 40–51 - PubMed
MeSH terms
Substances
Associated data
- Actions
- Actions
LinkOut - more resources
Full Text Sources
Other Literature Sources
Miscellaneous
