

Mitochondrial Respiratory Defect Causes Dysfunctional Lactate Turnover via AMP-activated Protein Kinase Activation in Human-induced Pluripotent Stem Cell-derived Hepatocytes
- PMID: 26491018
- PMCID: PMC4705950
- DOI: 10.1074/jbc.M115.670364
Mitochondrial Respiratory Defect Causes Dysfunctional Lactate Turnover via AMP-activated Protein Kinase Activation in Human-induced Pluripotent Stem Cell-derived Hepatocytes
Abstract
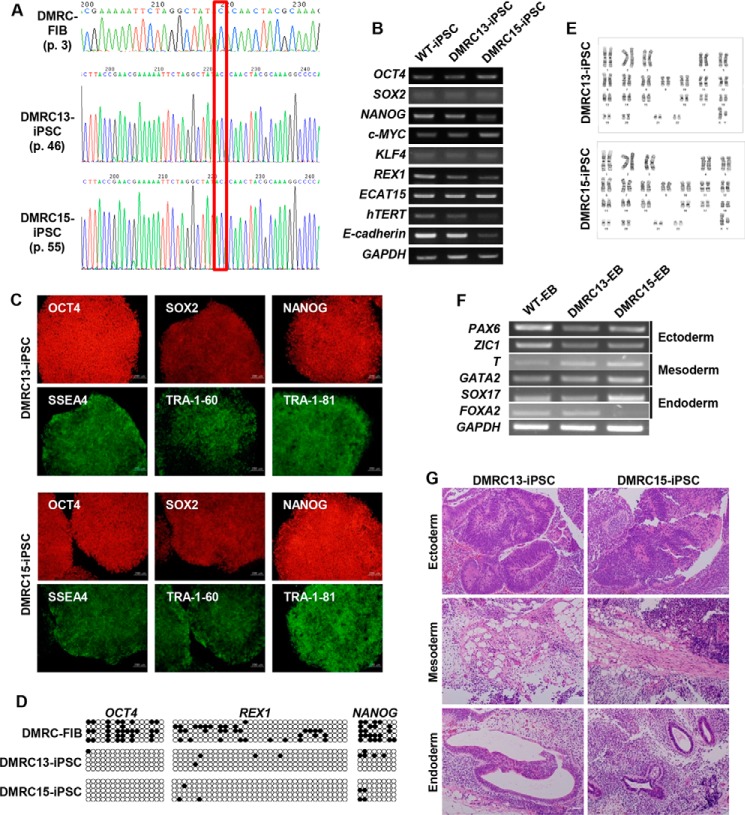
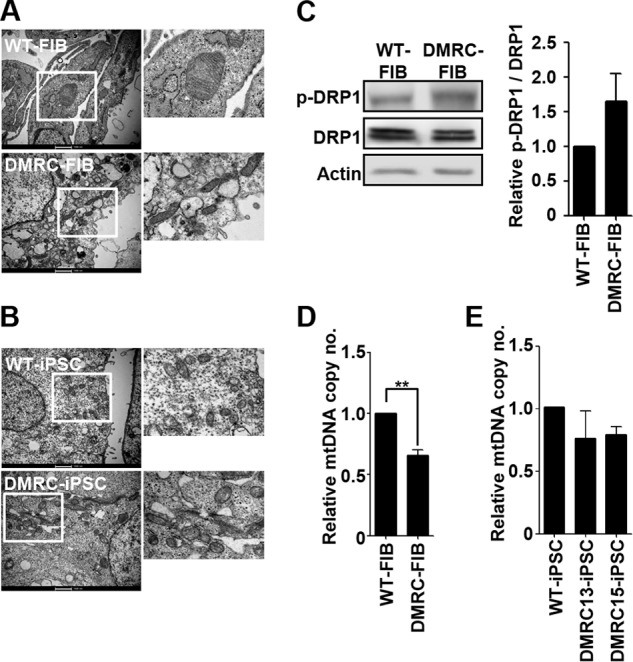
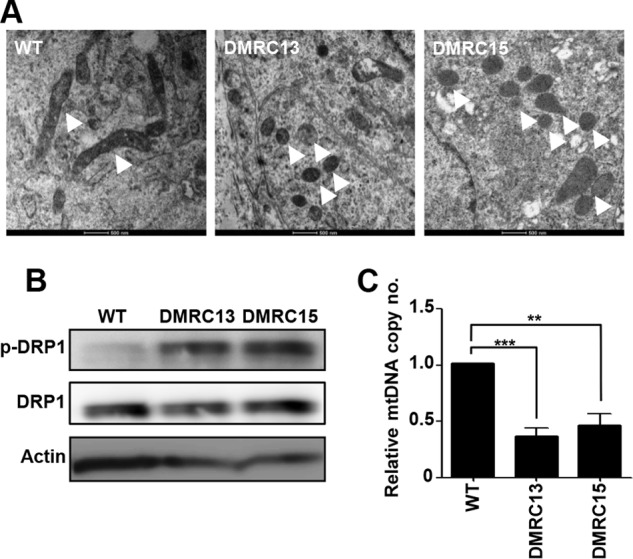
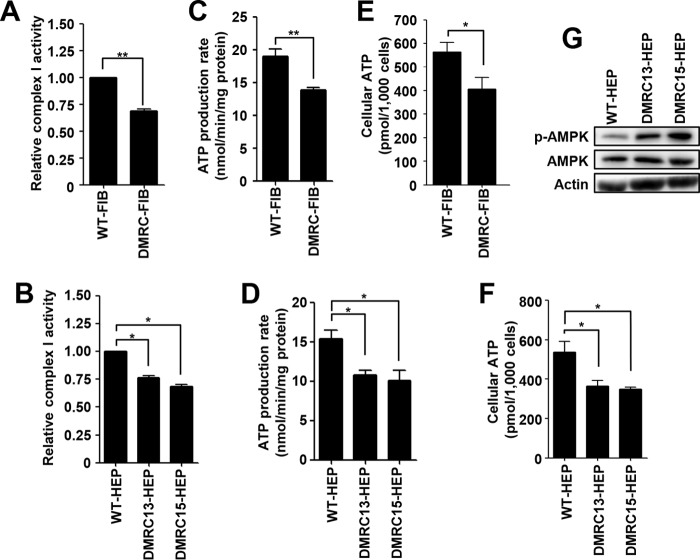
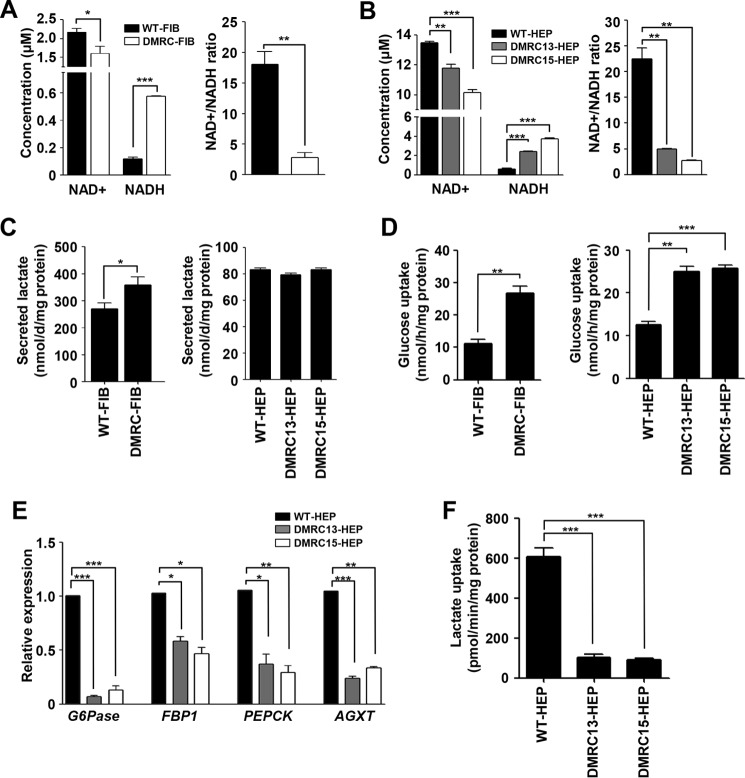
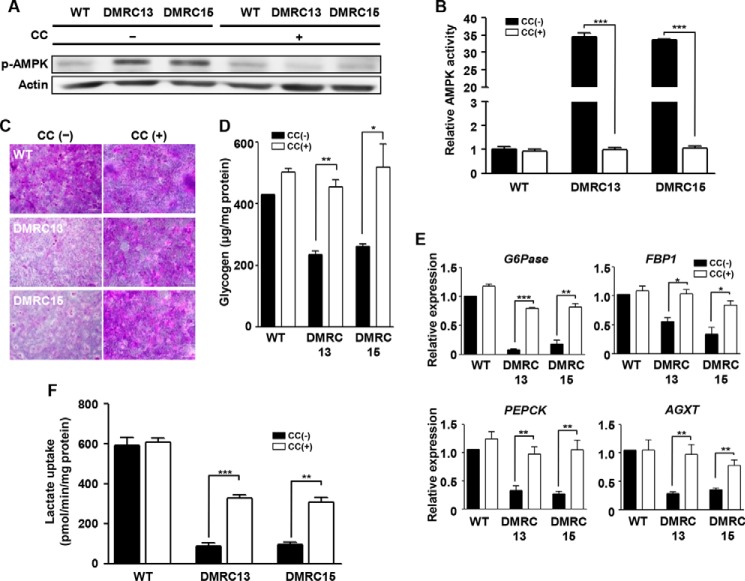
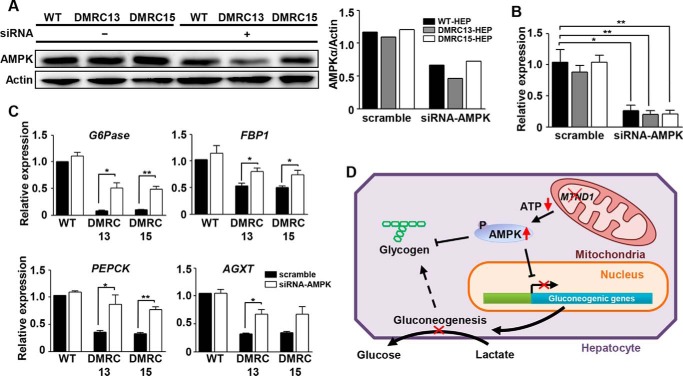
A defective mitochondrial respiratory chain complex (DMRC) causes various metabolic disorders in humans. However, the pathophysiology of DMRC in the liver remains unclear. To understand DMRC pathophysiology in vitro, DMRC-induced pluripotent stem cells were generated from dermal fibroblasts of a DMRC patient who had a homoplasmic mutation (m.3398T→C) in the mitochondrion-encoded NADH dehydrogenase 1 (MTND1) gene and that differentiated into hepatocytes (DMRC hepatocytes) in vitro. DMRC hepatocytes showed abnormalities in mitochondrial characteristics, the NAD(+)/NADH ratio, the glycogen storage level, the lactate turnover rate, and AMPK activity. Intriguingly, low glycogen storage and transcription of lactate turnover-related genes in DMRC hepatocytes were recovered by inhibition of AMPK activity. Thus, AMPK activation led to metabolic changes in terms of glycogen storage and lactate turnover in DMRC hepatocytes. These data demonstrate for the first time that energy depletion may lead to lactic acidosis in the DMRC patient by reduction of lactate uptake via AMPK in liver.
Keywords: hepatocyte; induced pluripotent stem cell (iPS cell) (iPSC); lactic acidosis; liver; liver metabolism; mitochondrial disease.
© 2015 by The American Society for Biochemistry and Molecular Biology, Inc.
Figures

Similar articles
-
Modeling inherited metabolic disorders of the liver using human induced pluripotent stem cells.J Clin Invest. 2010 Sep;120(9):3127-36. doi: 10.1172/JCI43122. Epub 2010 Aug 25. J Clin Invest. 2010. PMID: 20739751 Free PMC article.
-
A Screen Using iPSC-Derived Hepatocytes Reveals NAD+ as a Potential Treatment for mtDNA Depletion Syndrome.Cell Rep. 2018 Nov 6;25(6):1469-1484.e5. doi: 10.1016/j.celrep.2018.10.036. Cell Rep. 2018. PMID: 30404003 Free PMC article.
-
Introduction of an additional pathway for lactate oxidation in the treatment of lactic acidosis and mitochondrial dysfunction in Caenorhabditis elegans.Proc Natl Acad Sci U S A. 2005 Dec 20;102(51):18367-72. doi: 10.1073/pnas.0506939102. Epub 2005 Dec 12. Proc Natl Acad Sci U S A. 2005. PMID: 16344465 Free PMC article.
-
Molecular action of metformin in hepatocytes: an updated insight.Curr Diabetes Rev. 2015;11(3):175-81. doi: 10.2174/1573399811666150325233108. Curr Diabetes Rev. 2015. PMID: 25808533 Review.
-
Enzymes involved in l-lactate metabolism in humans.Mitochondrion. 2013 Nov;13(6):615-29. doi: 10.1016/j.mito.2013.08.011. Epub 2013 Sep 9. Mitochondrion. 2013. PMID: 24029012 Review.
Cited by
-
Metabolic Effects of Metformin in the Failing Heart.Int J Mol Sci. 2018 Sep 21;19(10):2869. doi: 10.3390/ijms19102869. Int J Mol Sci. 2018. PMID: 30248910 Free PMC article. Review.
-
Pluripotent Stem Cell-Derived Hepatocyte-like Cells: A Tool to Study Infectious Disease.Curr Pathobiol Rep. 2016 Sep;4(3):147-156. doi: 10.1007/s40139-016-0113-7. Epub 2016 Jul 30. Curr Pathobiol Rep. 2016. PMID: 29910973 Free PMC article.
-
Glycogen homeostasis and mtDNA expression require motor neuron to muscle TGFβ/Activin Signaling in Drosophila.bioRxiv [Preprint]. 2024 Jul 31:2024.06.25.600699. doi: 10.1101/2024.06.25.600699. bioRxiv. 2024. Update in: iScience. 2024 Dec 16;28(1):111611. doi: 10.1016/j.isci.2024.111611. PMID: 39131342 Free PMC article. Updated. Preprint.
-
Expressions Profiles of the Proteins Associated with Carbohydrate Metabolism in Rat Liver Regeneration.Biomed Res Int. 2017;2017:8428926. doi: 10.1155/2017/8428926. Epub 2017 Jul 2. Biomed Res Int. 2017. PMID: 28752099 Free PMC article.
-
Islet-like organoids derived from human pluripotent stem cells efficiently function in the glucose responsiveness in vitro and in vivo.Sci Rep. 2016 Oct 12;6:35145. doi: 10.1038/srep35145. Sci Rep. 2016. PMID: 27731367 Free PMC article.
References
-
- Hoppel C. L., Kerr D. S., Dahms B., and Roessmann U. (1987) Deficiency of the reduced nicotinamide adenine dinucleotide dehydrogenase component of complex I of mitochondrial electron transport. Fatal infantile lactic acidosis and hypermetabolism with skeletal-cardiac myopathy and encephalopathy. J. Clin. Invest. 80, 71–77 - PMC - PubMed
-
- Loeffen J. L., Smeitink J. A., Trijbels J. M., Janssen A. J., Triepels R. H., Sengers R. C., and van den Heuvel L. P. (2000) Isolated complex I deficiency in children: clinical, biochemical and genetic aspects. Hum. Mutat. 15, 123–134 - PubMed
-
- Triepels R. H., Van Den Heuvel L. P., Trijbels J. M., and Smeitink J. A. (2001) Respiratory chain complex I deficiency. Am. J. Med. Genet. 106, 37–45 - PubMed
-
- Wallace D. C., Singh G., Lott M. T., Hodge J. A., Schurr T. G., Lezza A. M., Elsas L. J. 2nd., and Nikoskelainen E. K. (1988) Mitochondrial DNA mutation associated with Leber's hereditary optic neuropathy. Science 242, 1427–1430 - PubMed
Publication types
MeSH terms
Substances
LinkOut - more resources
Full Text Sources
