Comparative Study
. 2015 Oct 21;90(1):379-91.
doi: 10.1128/JVI.02389-15. Print 2016 Jan 1.

Defensive Perimeter in the Central Nervous System: Predominance of Astrocytes and Astrogliosis during Recovery from Varicella-Zoster Virus Encephalitis

Affiliations
Comparative Study

Defensive Perimeter in the Central Nervous System: Predominance of Astrocytes and Astrogliosis during Recovery from Varicella-Zoster Virus Encephalitis

John E Carpenter et al. J Virol. .

Abstract

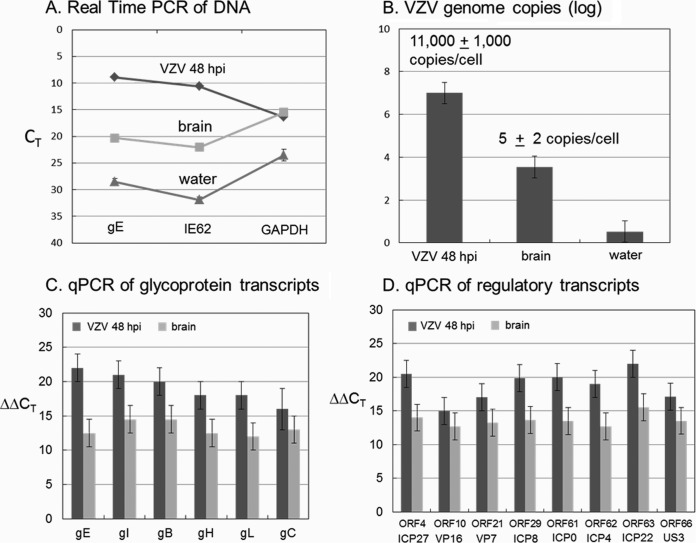
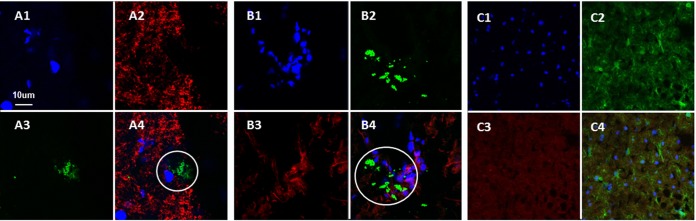
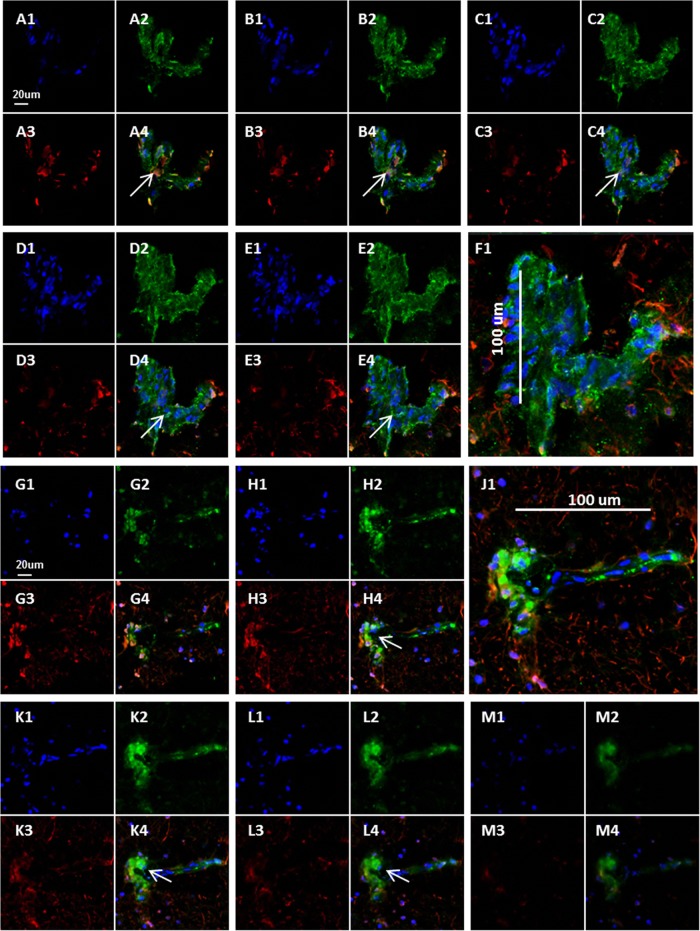
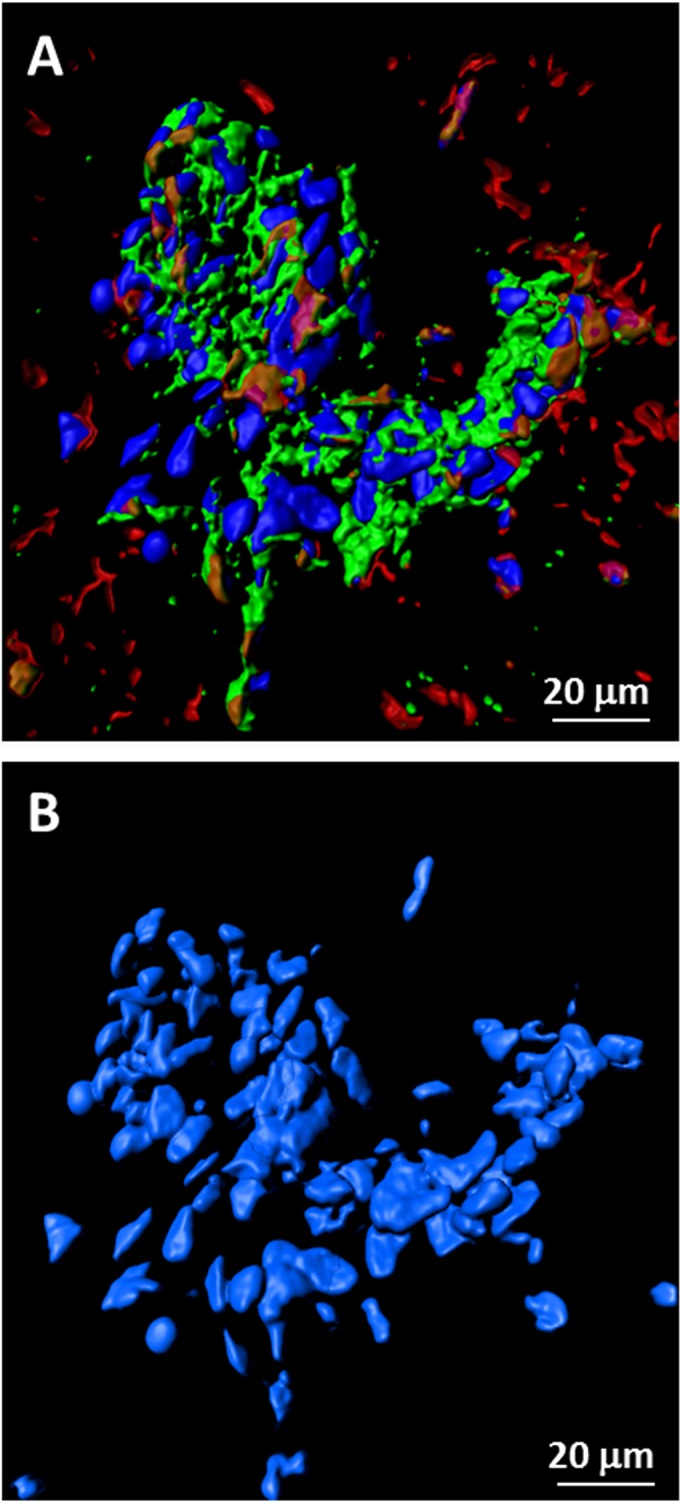
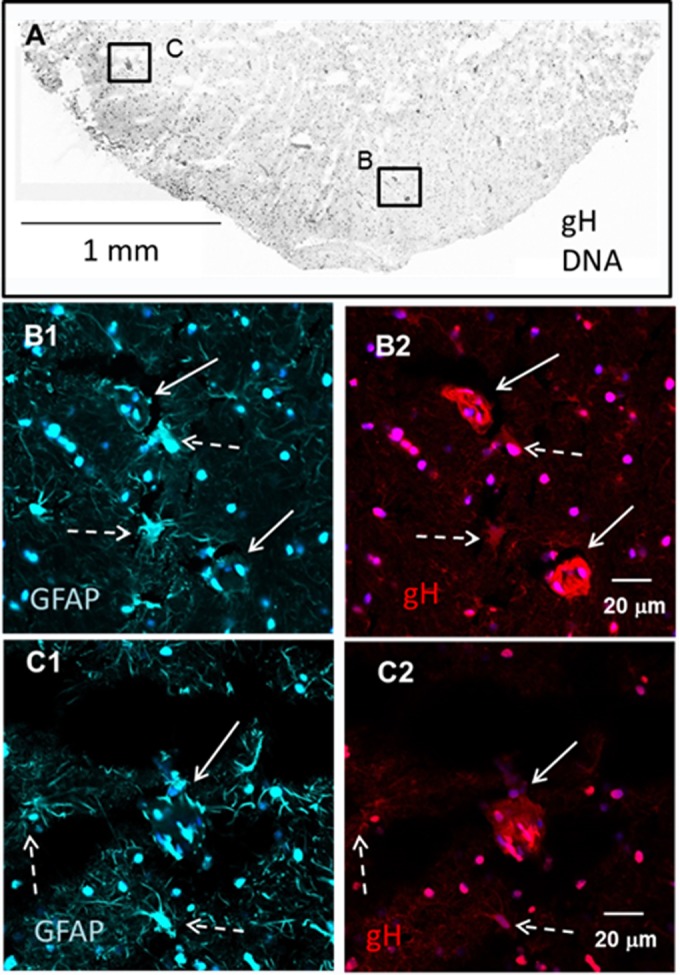
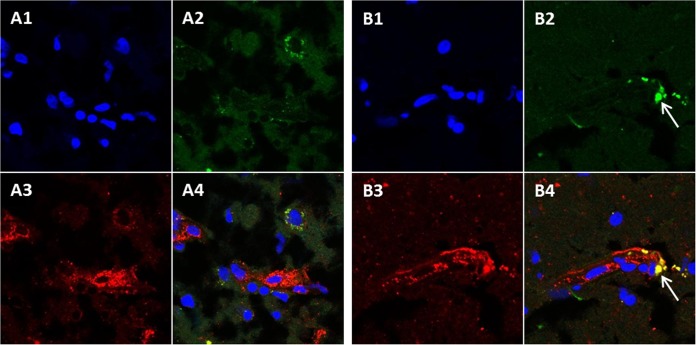
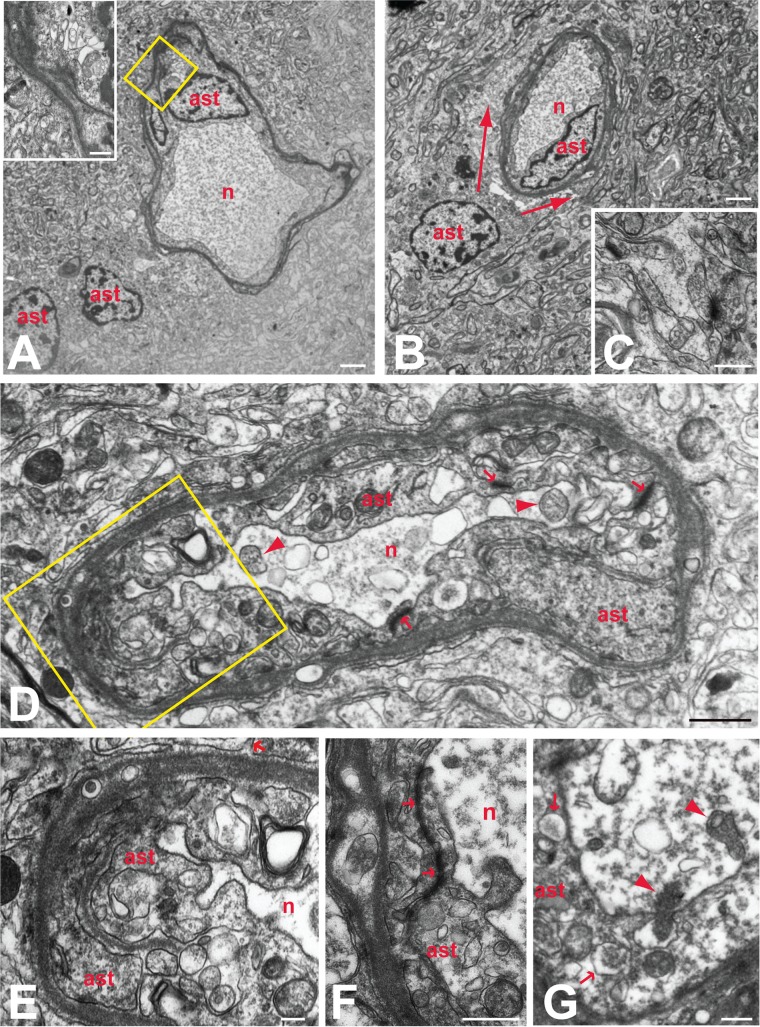
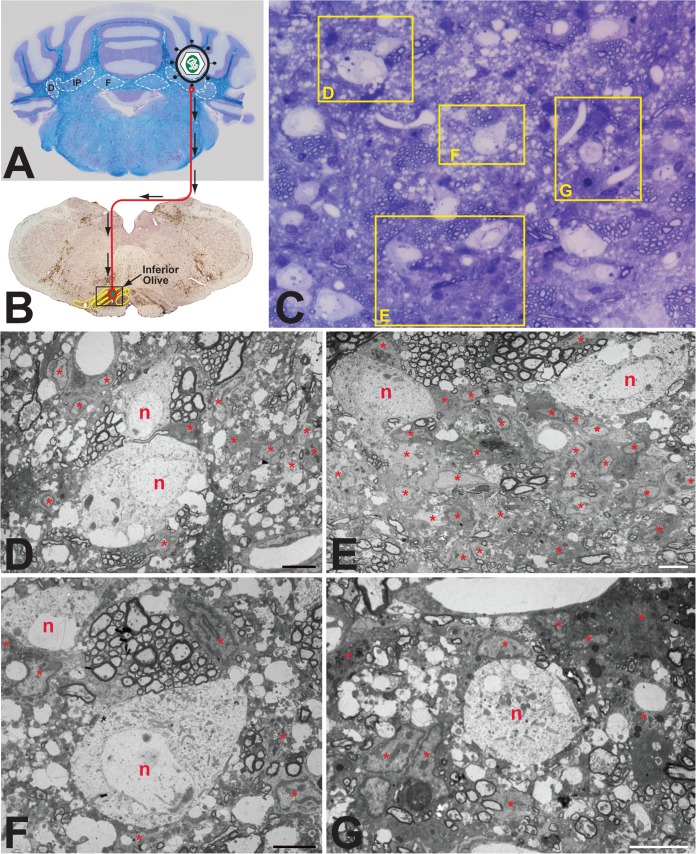
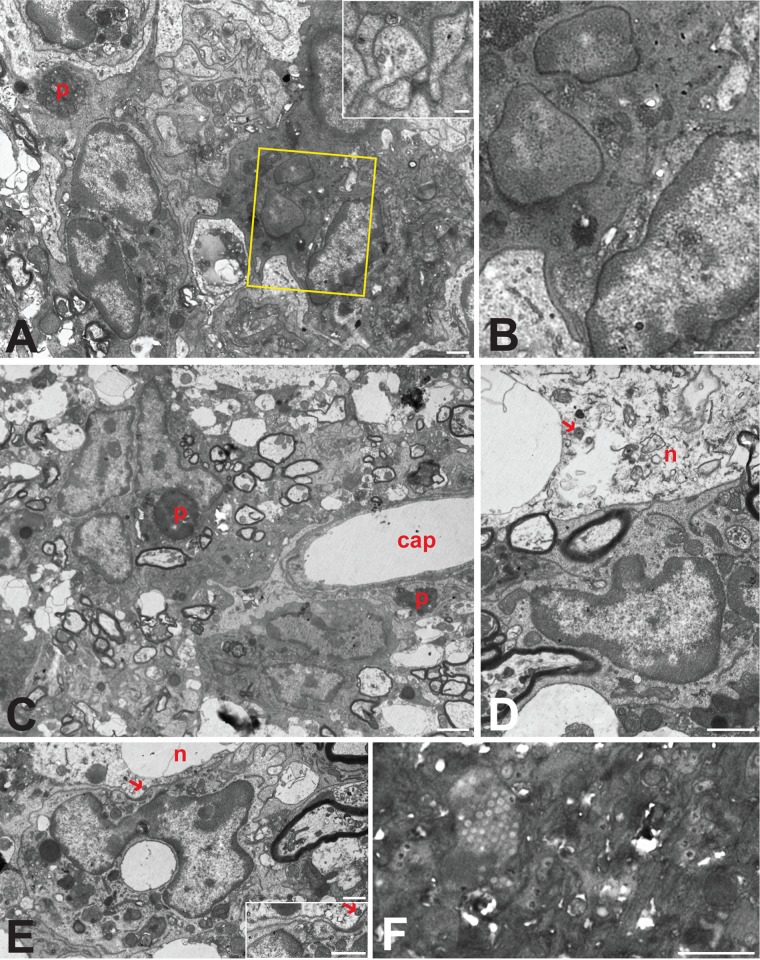
Varicella-zoster virus (VZV) is a highly neurotropic virus that can cause infections in both the peripheral nervous system and the central nervous system. Several studies of VZV reactivation in the peripheral nervous system (herpes zoster) have been published, while exceedingly few investigations have been carried out in a human brain. Notably, there is no animal model for VZV infection of the central nervous system. In this report, we characterized the cellular environment in the temporal lobe of a human subject who recovered from focal VZV encephalitis. The approach included not only VZV DNA/RNA analyses but also a delineation of infected cell types (neurons, microglia, oligodendrocytes, and astrocytes). The average VZV genome copy number per cell was 5. Several VZV regulatory and structural gene transcripts and products were detected. When colocalization studies were performed to determine which cell types harbored the viral proteins, the majority of infected cells were astrocytes, including aggregates of astrocytes. Evidence of syncytium formation within the aggregates included the continuity of cytoplasm positive for the VZV glycoprotein H (gH) fusion-complex protein within a cellular profile with as many as 80 distinct nuclei. As with other causes of brain injury, these results suggested that astrocytes likely formed a defensive perimeter around foci of VZV infection (astrogliosis). Because of the rarity of brain samples from living humans with VZV encephalitis, we compared our VZV results with those found in a rat encephalitis model following infection with the closely related pseudorabies virus and observed similar perimeters of gliosis.

Importance: Investigations of VZV-infected human brain from living immunocompetent human subjects are exceedingly rare. Therefore, much of our knowledge of VZV neuropathogenesis is gained from studies of VZV-infected brains obtained at autopsy from immunocompromised patients. These are not optimal samples with which to investigate a response by a human host to VZV infection. In this report, we examined both flash-frozen and paraffin-embedded formalin-fixed brain tissue of an otherwise healthy young male with focal VZV encephalitis, most likely acquired from VZV reactivation in the trigeminal ganglion. Of note, the cellular response to VZV infection mimicked the response to other causes of trauma to the brain, namely, an ingress of astrocytes and astrogliosis around an infectious focus. Many of the astrocytes themselves were infected; astrocytes aggregated in clusters. We postulate that astrogliosis represents a successful defense mechanism by an immunocompetent human host to eliminate VZV reactivation within neurons.


Figures

FIG 1
FIG 1
VZV DNA and RNA analyses. DNA and mRNA were extracted from two different pieces of human brain tissue as described in Materials and Methods. (A) VZV genomes. Using DNA from VZV-infected MeWo cells at 48 h postinfection (hpi) (diluted 1:10) as a positive control and DNA from a water sample from the laboratory bench as a negative control, real-time PCR was carried out on the brain tissue using primers to VZV ORF68 and ORF62 genes and the cellular gene coding for GAPDH. (B) VZV genome copies. Using a standard curve, the number of genome copies was calculated from the PCR measurements in panel A. Given a known number of cells in the positive control, the number of genome copies was calculated. (C) VZV glycoprotein gene transcripts. Reverse transcription (RT)-qPCR measurements were made using the primers in Table 1 against cDNA from VZV-infected MRC-5 fibroblast cells (dark gray) or from brain tissue (light gray). (D) VZV regulatory gene transcripts. The herpes simplex ortholog is listed beneath each VZV gene.
FIG 2
FIG 2
Lack of colocalization of VZV glycoproteins with neurofilaments, microglia, and oligodendrocytes. Three individual images and one merged image are included for each panel. Brain sections were labeled with rabbit antineurofilament antibody (red in panels A), IB4 lectin 568 conjugate for microglia (red in panels B), and murine RIP MAb for oligodendrocytes (red in panels C). Sections were also labeled with Hoechst H33342 (blue in panels A to C), anti-VZV gE MAb (green in panels A and B), and anti-VZV gH MAb (green in panels C). Circles indicate areas of detectable VZV antigen that do not colocalize with neurofilaments (A) or microglia (B).
FIG 3
FIG 3
Colocalization of VZV glycoproteins with astrocytes. Twelve images from two z-series are shown. (A to F) Brain section from the first brain section labeled with Hoechst H33342 (blue in panels A1 to E1), human anti-VZV gH MAb (green in panels A2 to E2), and murine anti-GFAP antibody (red in panels A3 to E3). The merge of panels F1 to -4 is shown in panel F1, with a scale bar to outline the astrocyte. (G to M) Brain section from second brain section labeled with Hoechst H33342 (blue in panels G1, H1, K1, L1, and M1), human anti-VZV gH MAb (green in panels G2, H2, K2, L2, and M2), and murine anti-GFAP antibody (red in panels G3, H3, K3, L3, and M3). The merge of panels J1 to -4 is shown in panel J1, with a scale bar to outline the astrocyte. Colocalization was seen (arrows).
FIG 4
FIG 4
Syncytium of VZV-infected astrocytes. Confocal images from Fig. 3 were converted by Imaris software into 3D animations (18). One frame from an animation was selected to illustrate the large number of nuclei (∼80) present within an area of fusion. Panel A retains all fluorescent labels; panel B includes only the blue double-stranded DNA (dsDNA) stain in order to delineate nuclei.
FIG 5
FIG 5
GFAP-positive cellular aggregates in the human brain. Sections were cut from the frozen brain tissue and immunolabeled with monoclonal antibodies to VZV gH and GFAP. (A) Landscape view. Many images were converted to black and white and combined to make a montage of VZV gH and nuclear staining (Hoechst H33342). Dense scattered areas of staining are readily apparent. Two dense areas are marked by boxes B and C. (B1 and -2). Fluorescent images of GFAP (B1) and gH (B2) positivity in box B within panel A. Two areas (solid white arrows) are VZV gH positive but show a downregulation of GFAP. Neighboring astrocytes (dashed white arrows) showed early infection and upregulation of GFAP. (C1 and -2). Fluorescent images of GFAP (C1) and gH (C2) positivity in box C within panel A. A single large infected aggregate (solid white arrow) also exhibited a downregulation of GFAP, while neighboring astrocytes (dashed white arrows) showed early infection and upregulation of GFAP.
FIG 6
FIG 6
VZV glycoproteins gC and gH in the brain. Brain section labeled with Hoechst H33342 (blue in panels A1 and B1), murine anti-VZV gC MAb (green in panels A2 and B2), and human anti-VZV gH MAb (red in panels A3 and B3). The merge of panels A1 to A3 and B1 to B3 is shown in panels A4 and B4. The white arrows in panels B2 and B4 indicate areas of gC and gH colocalization.
FIG 7
FIG 7
Reactive astrocytes and astrogliosis in VZV-infected human brain. The relationships of reactive astroglia (ast) to degenerating neurons (n) are illustrated in the electron micrographs. Barrier astroctyes formed intimate relations with degenerating neurons, entirely isolating the degenerating neurons from the surrounding neuropil (A to D). In some cases, more than one reactive astrocyte contributed to this barrier (A), with the cells fusing to form a syncytium (inset in panel A). These astrocytes were also the source of thin interleaving processes that isolated synaptic profiles within the neuropil (C; arrow in panel E). Reactive astroglia in the adjacent neuropil also contributed processes that surrounded barrier astrocytes (defined by arrows in panel B), further isolating degenerating neurons from the brain parenchyma. Prominent accumulation of dense proteinaceous material underlying the outer plasma membranes was a characteristic feature of all barrier astrocytes (A, B, D to F). This material also was present in processes that invaded deeper layers of the astrocyte barrier to fuse with other processes (boxed area in panel D, which is shown at higher magnification in panel E). Tight junctions formed between processes within the glial barrier (arrows in panels D and F) contributed to the complete isolation of ensconced neurons. Neurons isolated by the barrier astrocytes characteristically contained accumulations of flocculent material, vacuolization, and mitochondria in various states of degeneration (arrowheads in panels D and G). Phagocytosis of degenerating neurons by barrier astrocytes was also a characteristic feature of barrier astrocytes. One of two degenerating mitochondria marked by arrowheads in panel G is within a portion of the soma being phagocytosed by the barrier astrocyte. Arrowheads within that barrier astrocyte identify phagosomes that are similar in morphology to the cytoplasm within the portion of the neuron being phagocytosed. Marker bars by panel: A and B, 2 μm; C and G, 500 nm; D, 1 μm; E, 200 nm; F, 600 nm.
FIG 8
FIG 8
Experimental paradigm and cellular response to PRV infection in rat brain. (A and B) Paradigm. Injection of the PRV Bartha strain into the interpositus nucleus of the rat cerebellum (A) resulted in retrograde spread of virus to infect neurons within the inferior olive (B). The brown reaction product visible in panel B represents immunocytochemical localization of viral antigens marking infected cells within the inferior olive and surrounding brain stem 2 days after injection of virus. (C) Thick section. The panel is a toluidine blue-stained 1-μm section from the boxed area shown in panel B. Intensely basophilic cells define reactive glia in relation to infected neurons. (D to G) Thin sections. Processing of tissue adjacent to the thick section for TEM analysis revealed infected neurons (n) and reactive astrogliosis (ast) within the cerebellum. Because the number of astrocytes was so large, some are labeled internally with an asterisk. Several infected neurons exhibited vacuolization and were intimately associated with reactive glial cells and their processes. Marker bars for panels D to G are 6 μm.
FIG 9
FIG 9
Astrogliosis in the PRV-infected rat brain. The interrelations of multicellular aggregates of reactive astroglia adjacent to infected neurons from the fields shown in Fig. 8 are illustrated at higher magnification. Infected neurons exhibited pathological vacuolization (D and E) and contained mature virions (arrows). Aggregates of reactive glia in the immediate vicinity were directly apposed to infected neurons (D and E). Astroglia in aggregates also gave rise to interdigitating processes that isolated infected neurons from brain parenchyma and often contained capsids with no sign of envelopment (inset in panel A). Cells that contained larger number of capsids in either the nucleus (F) or cytoplasm (boxed portions are of panel A shown at higher magnification in panel B) typically exhibited cytoplasm that was more electron dense and also commonly displayed evidence of syncytium formation (B). Phagosomes (p) provided evidence of phagocytic activity by reactive astroglia within each aggregate, and astrocytes within the aggregate also completely invested adjacent capillaries (cap in panel C). Marker bars by panel: A, B, D, E, and F and inset in E, 1 μm; inset in A, 200 nm; C, 2 μm.

Similar articles

Cited by

References

    1. Weller TH. 1983. Varicella and herpes zoster. Changing concepts of the natural history, control, and importance of a not-so-benign virus. N Engl J Med 309:1434–1440. - PubMed
    1. Hope-Simpson RE. 1965. The nature of herpes zoster: a long-term study and a new hypothesis. Proc R Soc Med 58:9–20. - PMC - PubMed
    1. Zerboni L, Sen N, Oliver SL, Arvin AM. 2014. Molecular mechanisms of varicella zoster virus pathogenesis. Nat Rev Microbiol 12:197–210. doi:10.1038/nrmicro3215. - DOI - PMC - PubMed
    1. Kennedy PG, Rovnak J, Badani H, Cohrs RJ. 2015. A comparison of HSV-1 and VZV latency and reactivation. J Gen Virol 96:1581–1602. doi:10.1099/vir.0.000128. - DOI - PMC - PubMed
    1. Arvin AM. 2006. Investigations of the pathogenesis of varicella zoster virus infection in the SCIDhu mouse model. Herpes 13:75–80. - PubMed

Publication types

MeSH terms