. 2015 Oct 21;90(1):444-56.
doi: 10.1128/JVI.02175-15. Print 2016 Jan 1.

Identification of a Novel Viral Protein Expressed from the PB2 Segment of Influenza A Virus

Affiliations

Identification of a Novel Viral Protein Expressed from the PB2 Segment of Influenza A Virus

Seiya Yamayoshi et al. J Virol. .

Abstract

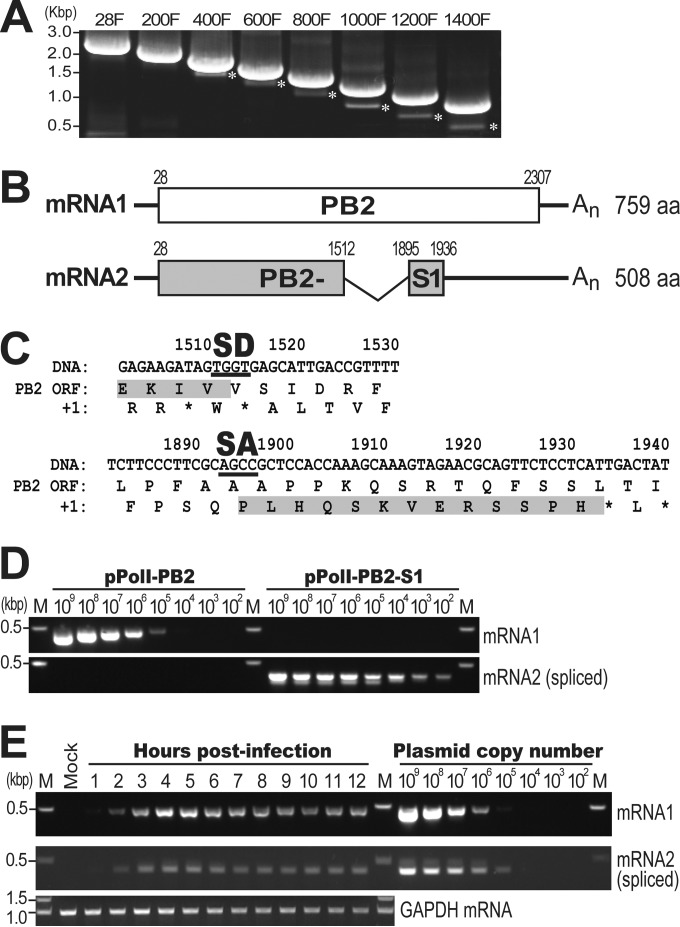
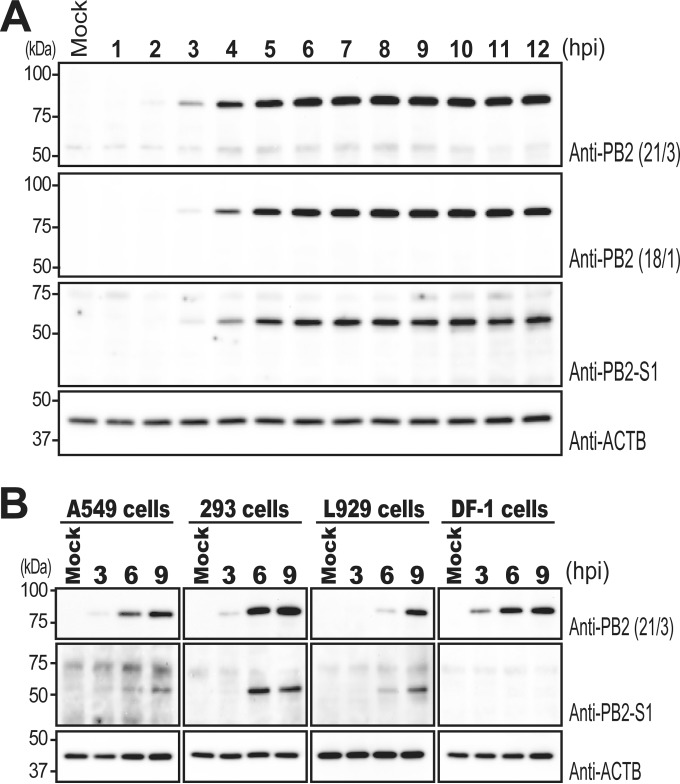
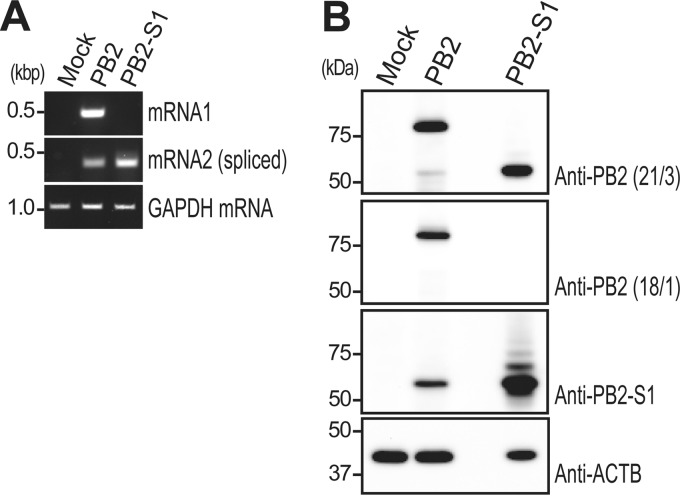
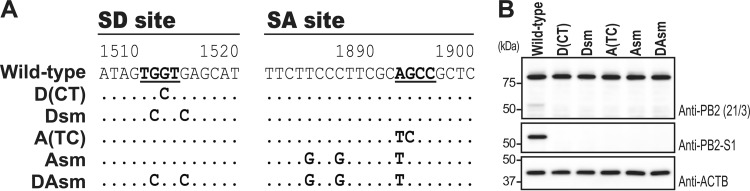
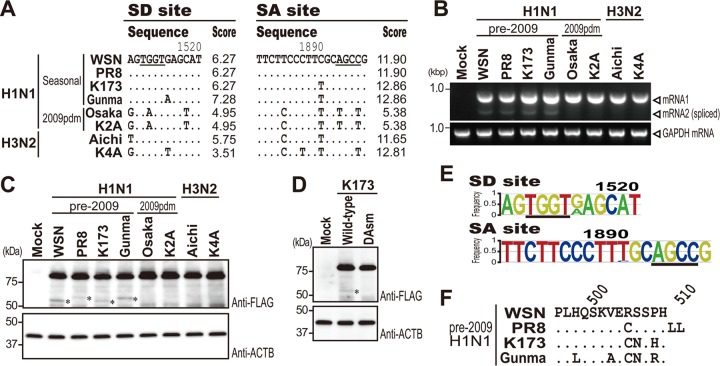
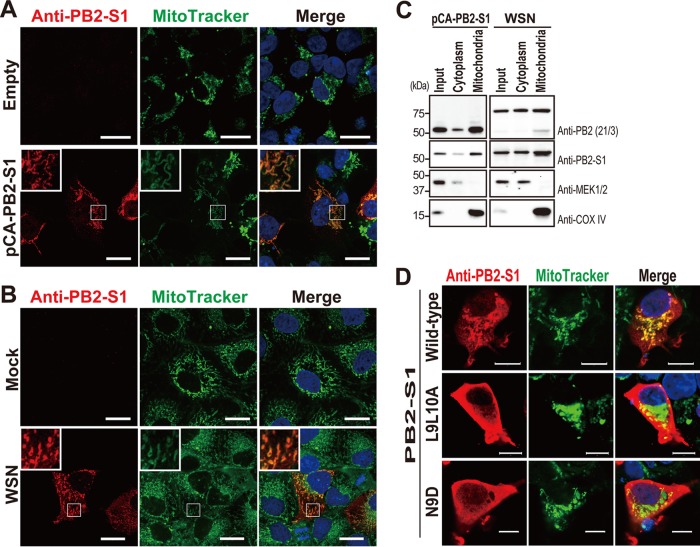
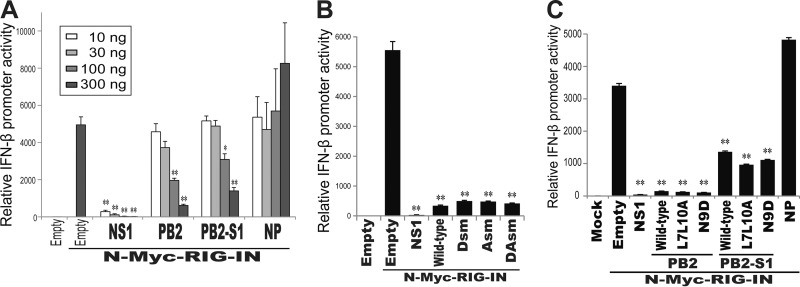
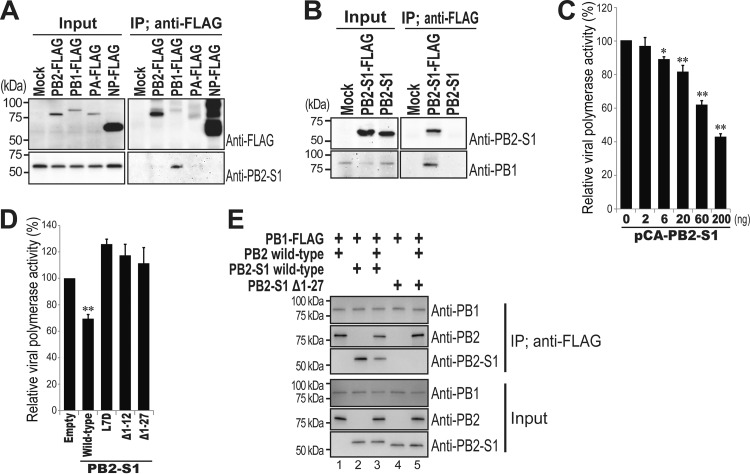
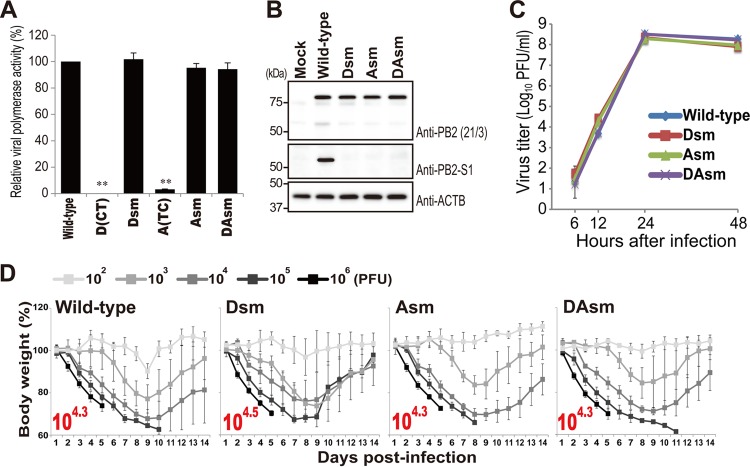
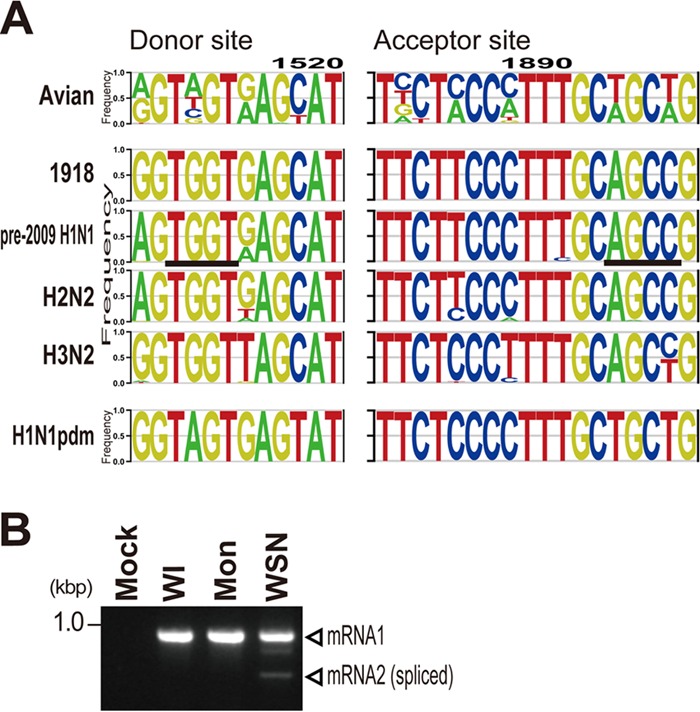
Over the past 2 decades, several novel influenza virus proteins have been identified that modulate viral infections in vitro and/or in vivo. The PB2 segment, which is one of the longest influenza A virus segments, is known to encode only one viral protein, PB2. In the present study, we used reverse transcription-PCR (RT-PCR) targeting viral mRNAs transcribed from the PB2 segment to look for novel viral proteins encoded by spliced mRNAs. We identified a new viral protein, PB2-S1, encoded by a novel spliced mRNA in which the region corresponding to nucleotides 1513 to 1894 of the PB2 mRNA is deleted. PB2-S1 was detected in virus-infected cells and in cells transfected with a protein expression plasmid encoding PB2. PB2-S1 localized to mitochondria, inhibited the RIG-I-dependent interferon signaling pathway, and interfered with viral polymerase activity (dependent on its PB1-binding capability). The nucleotide sequences around the splicing donor and acceptor sites for PB2-S1 were highly conserved among pre-2009 human H1N1 viruses but not among human H1N1pdm and H3N2 viruses. PB2-S1-deficient viruses, however, showed growth kinetics in MDCK cells and virulence in mice similar to those of wild-type virus. The biological significance of PB2-S1 to the replication and pathogenicity of seasonal H1N1 influenza A viruses warrants further investigation.

Importance: Transcriptome analysis of cells infected with influenza A virus has improved our understanding of the host response to viral infection, because such analysis yields considerable information about both in vitro and in vivo viral infections. However, little attention has been paid to transcriptomes derived from the viral genome. Here we focused on the splicing of mRNA expressed from the PB2 segment and identified a spliced viral mRNA encoding a novel viral protein. This result suggests that other, as yet unidentified viral proteins encoded by spliced mRNAs could be expressed in virus-infected cells. A viral transcriptome including the viral spliceosome should be evaluated to gain new insights into influenza virus infection.


Figures

FIG 1
FIG 1
Detection and open reading frame of a novel mRNA from the PB2 segment. (A) Analysis of mRNA expression from the PB2 segment in infected cells. 293 cells were infected with WSN at an MOI of 5. At 6 hpi, total RNA was extracted and reverse transcribed with an oligo(dT) primer. The cDNA from the PB2 gene was amplified by PCR with a series of forward primers that annealed to different positions of mRNA1 and a reverse primer that annealed to the 3′ end of mRNA1. Each asterisk indicates the PCR product of a novel mRNA2. (B) Schematic diagram of an mRNA splice variant from the PB2 segment. The nucleotide coordinates of the splice donor (SD) and splice acceptor (SA) sites are shown for mRNA2. mRNA1 and mRNA2 encode PB2 and PB2-S1, respectively. The total numbers of amino acids are given on the right. (C) Nucleotide sequences (shown as cDNA sequences) and open reading frames (ORFs) around the SD and SA sites of WSN. The nucleotide sequence between the TG at the SD site and the CC at the SA site was deleted in mRNA2. The ORF of PB2-S1 is shaded. (D) Specific detection of mRNA1 and mRNA2 by PCR. PCR was carried out using 2 sets of primers, specific for mRNA1 and mRNA2, and plasmids encoding mRNA1 (pPolI-PB2) and mRNA2 (pPolI-PB2-S1). The number of amplification cycles was 25 for mRNA1 and 35 for mRNA2. Lane M, DNA size marker lane. (E) Detection of mRNA2 in virus-infected cells. MDCK cells were infected with WSN at an MOI of 10. At each indicated time point, total RNA was extracted and reverse transcribed with an oligo(dT) primer. PCR was carried out using 2 sets of primers, specific for mRNA1 and mRNA2. The number of amplification cycles was 20 for mRNA1 and 30 for mRNA2. pPolI-PB2 and pPolI-PB2-S1 were utilized as controls. GAPDH mRNA was amplified as an internal control. Lanes M, DNA size marker lanes.
FIG 2
FIG 2
Expression of PB2-S1 in virus-infected cells. (A) Time course analyses of PB2 and PB2-S1 expression. MDCK cells were infected with WSN at an MOI of 10. At each indicated time point, total cell lysates were analyzed by Western blotting with two anti-PB2 monoclonal antibodies (clones 21/3 and 18/1), an anti-PB2-S1 antibody, and an anti-ACTB antibody. (B) PB2-S1 expression in human and mouse cells. Human A549 cells, human 293 cells, mouse L929 cells, and avian DF-1 cells were infected with WSN at an MOI of 10. Total cell lysates were analyzed by Western blotting with the anti-PB2 (clone 21/3), anti-PB2-S1, and anti-ACTB antibodies at 3, 6, and 9 hpi.
FIG 3
FIG 3
PB2-S1 expression in plasmid-transfected cells. 293 cells were transfected with an empty plasmid (mock) or a plasmid encoding PB2 or PB2-S1. At 24 h posttransfection, total RNA and total cell lysates were prepared. (A) Total RNA was reverse transcribed with an oligo(dT) primer. PCR was performed with 2 sets of primers, specific for mRNA1 and mRNA2. The number of amplification cycles was 18 for mRNA1 and 23 for mRNA2. GAPDH mRNA was amplified as an internal control. (B) Total cell lysates were analyzed by Western blotting with the two anti-PB2 monoclonal antibodies (clones 21/3 and 18/1), the anti-PB2-S1 antibody, and the anti-ACTB antibody.
FIG 4
FIG 4
PB2-S1 expression from PB2 possessing mutations in its SD and/or SA site. (A) Nucleotide sequences of PB2 mutants tested for PB2-S1 expression. The SD and SA sites are underlined. The V496L and A623P amino acid mutations are caused by the G1513C substitution in the D(CT) mutant and the A1893T substitution in the A(TC) mutant, respectively. The other nucleotide substitutions did not change the amino acid residues. (B) PB2-S1 expression in plasmid-transfected cells. 293 cells were transfected with plasmids encoding the indicated PB2 proteins. Total cell lysates were analyzed with the anti-PB2 antibody (clone 21/3), the anti-PB2-S1 antibody, and the anti-ACTB antibody.
FIG 5
FIG 5
PB2-S1 expression from PB2 derived from 8 human isolates. (A) Comparison of nucleotide sequences around the SD and SA sites of A/Puerto Rico/8/34 (PR8), A/Kawasaki/173/2001 (K173), A/Gunma/07G006/2008 (Gunma), A/Osaka/164/2009 (Osaka), A/Yokohama/UT-K2A/2011 (K2A), A/Aichi/2/68 (Aichi), and A/Yokohama/UT-K4A/2011 (K4A). The SD and SA sites are underlined. The scores denote splicing site scores and represent how similar the splice sites are to the consensus sequence. A high score is indicative of a strong splice site. (B) Expression of PB2 mRNA2 in virus-infected cells. MDCK cells were infected with each indicated isolate at an MOI of 10. At 6 hpi, total RNA was extracted and reverse transcribed with the oligo(dT) primer. The cDNA from the PB2 gene was amplified by PCR with primers uniPB2-1388F and 2307R annealed to PB2 mRNA1. GAPDH mRNA was amplified as an internal control. (C) PB2-S1 expression in plasmid-transfected cells. 293 cells were transfected with a plasmid encoding FLAG-tagged PB2 proteins derived from 8 human isolates. Total cell lysates were analyzed by Western blotting with anti-FLAG and anti-ACTB antibodies. Asterisks indicate the PB2-S1 signal. (D) PB2-S1 expression from K173 wild-type and K173 DAsm mutant PB2. 293 cells were transfected with a plasmid encoding FLAG-tagged wild-type or DAsm mutant PB2. Total cell lysates were analyzed with anti-FLAG and anti-ACTB antibodies. Asterisks indicate the PB2-S1 signal. (E) Energy-normalized sequence logo (enoLOGOS) plots around the SD and SA sites. The height of each represented base is weighted on the basis of its frequency at a given position within the 1,514 PB2 sequences of pre-2009 human H1N1 isolates. The SD and SA sites are underlined. (F) Comparison of PB2-S1-specific amino acid sequences. Amino acid sequences of PB2-S1 proteins, after the splicing junction site, are shown for WSN, PR8, K173, and Gunma.
FIG 6
FIG 6
PB2-S1 localizes to mitochondria via its N-terminal mitochondrial localization signal. (A and B) Microscopic analyses of the intracellular localization of PB2-S1. 293 cells were transfected with empty plasmid (empty) or the plasmid encoding PB2-S1 (pCA-PB2-S1) (A), and MDCK cells were mock infected (mock) or infected with WSN at an MOI of 0.1 (WSN) (B). At 24 h posttransfection and 6 hpi, the cells were stained with the anti-PB2-S1 antibody (red) and MitoTracker (green). Nuclei were stained with Hoechst 33342 (blue). Insets show higher-magnification views of the indicated portions of the cells. Bars, 20 μm. (C) Analysis of the intracellular localization of PB2-S1 by means of subcellular fractionation. 293 cells were transfected with the plasmid encoding PB2-S1 (pCA-PB2-S1), and MDCK cells were infected with WSN at an MOI of 10 (WSN). At 24 h posttransfection and 9 hpi, cell lysates (input) were fractionated into cytosolic (cytoplasm) and mitochondrial (mitochondria) fractions and then analyzed by Western blotting with the anti-PB2 antibody (clone 21/3), the anti-PB2-S1 antibody, an anti-MEK1/2 antibody (cytosol), or an anti-COX IV antibody (mitochondria). (D) Intracellular localization of mutant PB2-S1. 293 cells were transfected with the plasmid encoding wild-type PB2-S1, PB2-S1 L7L10A, or PB2-S1 N9D. The cells were stained with the anti-PB2-S1 antibody (red), MitoTracker (green), and Hoechst 33342 (blue) at 24 h posttransfection. Bars, 10 μm.
FIG 7
FIG 7
PB2-S1 interferes with the RIG-I-dependent IFN signaling pathway. (A) Inhibition of the RIG-I-dependent IFN signaling pathway by PB2-S1. 293T cells were transfected with the indicated viral protein expression plasmids, p125-luc, and pRL-null, with or without a plasmid encoding the constitutively active mutant N-Myc-RIG-IN. Firefly and Renilla luciferase activities were measured by means of a dual-luciferase assay. IFN-β promoter activity was calculated by normalization of the firefly luciferase activity to the Renilla luciferase activity. The IFN-β promoter activity without N-Myc-RIG-IN was set to 1. The data are shown as mean relative IFN-β promoter activities ± standard deviations (n = 3). * and **, P < 0.05 and P < 0.01, respectively (one-way analysis of variance [ANOVA] followed by Dunnett's test). (B and C) Inhibition of the RIG-I-dependent IFN signaling pathway by PB2-S1-deficient PB2 and mitochondrial localization-deficient PB2-S1. IFN-β promoter assays were performed using plasmids encoding PB2-S1-deficient PB2 and mitochondrial localization-deficient PB2 or PB2-S1. The data are shown as the mean relative IFN-β promoter activities ± standard deviations (n = 3). **, P < 0.01 (one-way ANOVA followed by Dunnett's test).
FIG 8
FIG 8
PB2-S1 interacts with PB1 and disrupts viral polymerase activity. (A and B) Interaction of PB2-S1 with PB1. PB2-S1 was coexpressed with PB2-FLAG, PB1-FLAG, PA-FLAG, or NP-FLAG in 293T cells (A), or PB1 was coexpressed with PB2-S1-FLAG or PB2-S1 in 293T cells (B). After immunoprecipitation with an anti-FLAG antibody, the precipitated proteins were analyzed by Western blotting with an anti-FLAG antibody, the anti-PB2-S1 antibody, and an anti-PB1 antibody. Input and IP, total cell lysates and immunoprecipitated samples, respectively. (C and D) PB2-S1 inhibited viral polymerase activity by interacting with PB1. 293 cells were transfected with plasmids encoding PB2, PB1, PA, and NP (50 ng each), with a plasmid encoding wild-type (C) or mutant (D) PB2-S1, with pPolI-NP (0)Fluc (0), and with pRL-null. Firefly and Renilla luciferase activities were measured by means of a dual-luciferase assay. Polymerase activity was calculated by normalization of the firefly luciferase activity to the Renilla luciferase activity. The polymerase activity without PB2-S1 was set to 100%. The data are shown as mean relative polymerase activities ± standard deviations (n = 3). * and **, P < 0.05 and P < 0.01, respectively (one-way ANOVA followed by Dunnett's test). (E) Competitive binding of PB2 and PB2-S1 to PB1. PB1-FLAG was coexpressed with the indicated combination of PB2 and/or PB2-S1 or its mutant in 293T cells. After immunoprecipitation with the anti-FLAG antibody, the precipitated proteins were analyzed by Western blotting with the anti-PB2 antibody (clone 18/1), the anti-PB2-S1 antibody, and the anti-PB1 antibody. Input and IP, total cell lysates and immunoprecipitated samples, respectively.
FIG 9
FIG 9
Properties of PB2-S1-deficient viruses. (A) Viral polymerase activity of PB2-S1-deficient PB2. 293 cells were transfected with plasmids encoding PB1, PA, NP, and wild-type or mutant PB2, with pPolI-NP (0)Fluc (0), and with pRL-null. Polymerase activity was calculated as described in the legend to Fig. 8. The data are shown as mean relative polymerase activities ± standard deviations (n = 3). **, P < 0.01 (one-way ANOVA followed by Dunnett's test). (B) PB2-S1 expression in cells infected with viruses possessing SD and/or SA site mutations in PB2. MDCK cells were infected with the indicated mutant viruses at an MOI of 10. At 9 hpi, total cell lysates were analyzed by Western blotting with the anti-PB2 antibody (clone 21/3), the anti-PB2-S1 antibody, and the anti-ACTB antibody. (C) Viral growth kinetics of PB2-S1-deficient viruses in MDCK cells. MDCK cells were infected with the indicated viruses at an MOI of 0.001. At each indicated time point, virus titers were determined by means of plaque assays. The data are shown as mean virus titers ± standard deviations (n = 3). (D) Virulence of mutant viruses in mice. Five mice per group were inoculated intranasally with 102, 103, 104, 105, or 106 PFU (each in 50 μl) of the indicated viruses. Body weight and survival were monitored daily for 14 days. The values represent average body weights compared to baseline weights ± standard deviations for five mice. MLD50 values (shown in red) were calculated according to the Spearman-Karber method.
FIG 10
FIG 10
Conservation of the SD and SA sites of PB2. (A) enoLOGOS plots around the SD and SA sites. The height of each represented base is weighted on the basis of its frequency at a given position within 1,514 PB2 sequences of pre-2009 human H1N1 isolates, 2,278 PB2 sequences of avian viruses (isolated after 2010), 103 PB2 sequences of human H2N2 viruses, 4,851 PB2 sequences of human H3N2 viruses, and 4,469 PB2 sequences of human H1N1pdm viruses. 1918, A/Brevig Mission/1/18. The SD and SA sites in pre-2009 H1N1 viruses are underlined. (B) Expression of PB2 mRNA2 in avian influenza virus-infected cells. MDCK cells were infected with A/duck/Wisconsin/8/74 (H3N2; WI) or A/duck/Mongolia/301/2001 (H3N2; Mon) at an MOI of 10. At 6 hpi, RT-PCR was performed with primers uniPB2-1388F and 2307R annealed to PB2 mRNA1. WSN served as a positive control.

Similar articles

Cited by

References

    1. McGeoch D, Fellner P, Newton C. 1976. Influenza virus genome consists of eight distinct RNA species. Proc Natl Acad Sci U S A 73:3045–3049. doi:10.1073/pnas.73.9.3045. - DOI - PMC - PubMed
    1. Palese P, Schulman JL. 1976. Mapping of the influenza virus genome: identification of the hemagglutinin and the neuraminidase genes. Proc Natl Acad Sci U S A 73:2142–2146. doi:10.1073/pnas.73.6.2142. - DOI - PMC - PubMed
    1. Ritchey MB, Palese P, Schulman JL. 1976. Mapping of the influenza virus genome. III. Identification of genes coding for nucleoprotein, membrane protein, and nonstructural protein. J Virol 20:307–313. - PMC - PubMed
    1. Palese P, Ritchey MB, Schulman JL. 1977. Mapping of the influenza virus genome. II. Identification of the P1, P2, and P3 genes. Virology 76:114–121. - PubMed
    1. Lamb RA, Lai CJ, Choppin PW. 1981. Sequences of mRNAs derived from genome RNA segment 7 of influenza virus: colinear and interrupted mRNAs code for overlapping proteins. Proc Natl Acad Sci U S A 78:4170–4174. doi:10.1073/pnas.78.7.4170. - DOI - PMC - PubMed

Publication types

MeSH terms

LinkOut - more resources