Postmitotic Expression of SOD1(G93A) Gene Affects the Identity of Myogenic Cells and Inhibits Myoblasts Differentiation
- PMID: 26491230
- PMCID: PMC4600922
- DOI: 10.1155/2015/537853
Postmitotic Expression of SOD1(G93A) Gene Affects the Identity of Myogenic Cells and Inhibits Myoblasts Differentiation
Abstract
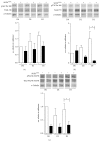
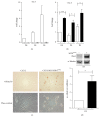
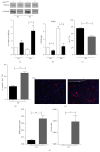
To determine the role of mutant SOD1 gene (SOD1(G93A)) on muscle cell differentiation, we derived C2C12 muscle cell lines carrying a stably transfected SOD1(G93A) gene under the control of a myosin light chain (MLC) promoter-enhancer cassette. Expression of MLC/SOD1(G93A) in C2C12 cells resulted in dramatic inhibition of myoblast differentiation. Transfected SOD1(G93A) gene expression in postmitotic skeletal myocytes downregulated the expression of relevant markers of committed and differentiated myoblasts such as MyoD, Myogenin, MRF4, and the muscle specific miRNA expression. The inhibitory effects of SOD1(G93A) gene on myogenic program perturbed Akt/p70 and MAPK signaling pathways which promote differentiation cascade. Of note, the inhibition of the myogenic program, by transfected SOD1(G93A) gene expression, impinged also the identity of myogenic cells. Expression of MLC/SOD1(G93A) in C2C12 myogenic cells promoted a fibro-adipogenic progenitors (FAPs) phenotype, upregulating HDAC4 protein and preventing the myogenic commitment complex BAF60C-SWI/SNF. We thus identified potential molecular mediators of the inhibitory effects of SOD1(G93A) on myogenic program and disclosed potential signaling, activated by SOD1(G93A), that affect the identity of the myogenic cell population.
Figures


Similar articles
-
Failure of Myf5 to support myogenic differentiation without myogenin, MyoD, and MRF4.Dev Biol. 2000 Mar 15;219(2):287-98. doi: 10.1006/dbio.2000.9621. Dev Biol. 2000. PMID: 10694423
-
MiR-183-5p induced by saturated fatty acids regulates the myogenic differentiation by directly targeting FHL1 in C2C12 myoblasts.BMB Rep. 2020 Nov;53(11):605-610. doi: 10.5483/BMBRep.2020.53.11.175. BMB Rep. 2020. PMID: 33148375 Free PMC article.
-
Ubiquitin-specific protease 4 (USP4) suppresses myoblast differentiation by down regulating MyoD activity in a catalytic-independent manner.Cell Signal. 2017 Jul;35:48-60. doi: 10.1016/j.cellsig.2017.03.008. Epub 2017 Mar 21. Cell Signal. 2017. PMID: 28336234
-
[Interactions of proliferation and differentiation signaling pathways in myogenesis].Postepy Hig Med Dosw (Online). 2014 May 8;68:516-26. doi: 10.5604/17322693.1101617. Postepy Hig Med Dosw (Online). 2014. PMID: 24864103 Review. Polish.
-
p38α MAPK disables KMT1A-mediated repression of myogenic differentiation program.Skelet Muscle. 2016 Aug 22;6:28. doi: 10.1186/s13395-016-0100-z. eCollection 2016. Skelet Muscle. 2016. PMID: 27551368 Free PMC article.
Cited by
-
The multifaceted roles of BAF60 subunits in muscle: regulation of differentiation, reprogramming, and metabolic homeostasis.Front Cell Dev Biol. 2025 Jun 26;13:1594423. doi: 10.3389/fcell.2025.1594423. eCollection 2025. Front Cell Dev Biol. 2025. PMID: 40641605 Free PMC article. Review.
-
Dynein disruption perturbs post-synaptic components and contributes to impaired MuSK clustering at the NMJ: implication in ALS.Sci Rep. 2016 Jun 10;6:27804. doi: 10.1038/srep27804. Sci Rep. 2016. PMID: 27283349 Free PMC article.
-
Skeletal Muscle MicroRNAs as Key Players in the Pathogenesis of Amyotrophic Lateral Sclerosis.Int J Mol Sci. 2018 May 22;19(5):1534. doi: 10.3390/ijms19051534. Int J Mol Sci. 2018. PMID: 29786645 Free PMC article. Review.
-
Secreted Metabolome of ALS-Related hSOD1(G93A) Primary Cultures of Myocytes and Implications for Myogenesis.Cells. 2023 Nov 30;12(23):2751. doi: 10.3390/cells12232751. Cells. 2023. PMID: 38067180 Free PMC article.
-
The myokine FGF21 associates with enhanced survival in ALS and mitigates stress-induced cytotoxicity.bioRxiv [Preprint]. 2024 Sep 14:2024.09.11.611693. doi: 10.1101/2024.09.11.611693. bioRxiv. 2024. Update in: Aging (Albany NY). 2025 Aug 9;17(8):2033-2062. doi: 10.18632/aging.206298. PMID: 39314333 Free PMC article. Updated. Preprint.
References
-
- Dobrowolny G., Aucello M., Rizzuto E., et al. Skeletal muscle is a primary target of SOD1G93A-mediated toxicity. Cell Metabolism. 2008;8(5):425–436. - PubMed
Publication types
MeSH terms
Substances
Grants and funding
LinkOut - more resources
Full Text Sources
Other Literature Sources
Miscellaneous

