. 2015 Nov 2;11(11):1998-2013.
doi: 10.1080/15548627.2015.1091551.

FGFR3/fibroblast growth factor receptor 3 inhibits autophagy through decreasing the ATG12-ATG5 conjugate, leading to the delay of cartilage development in achondroplasia

Affiliations

FGFR3/fibroblast growth factor receptor 3 inhibits autophagy through decreasing the ATG12-ATG5 conjugate, leading to the delay of cartilage development in achondroplasia

Xiaofeng Wang et al. Autophagy. .

Abstract

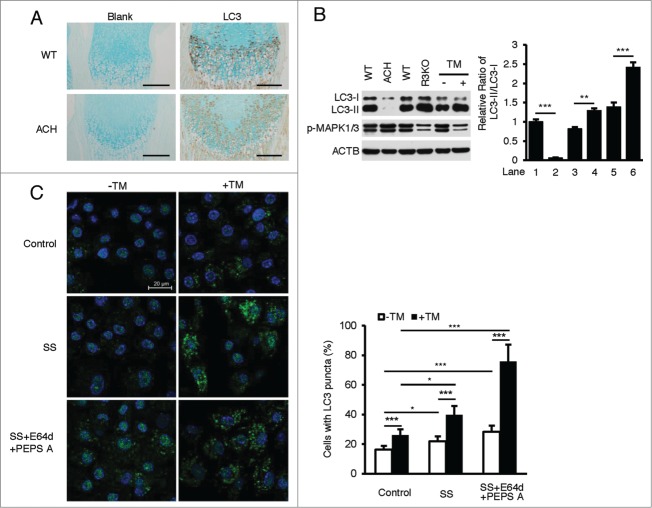
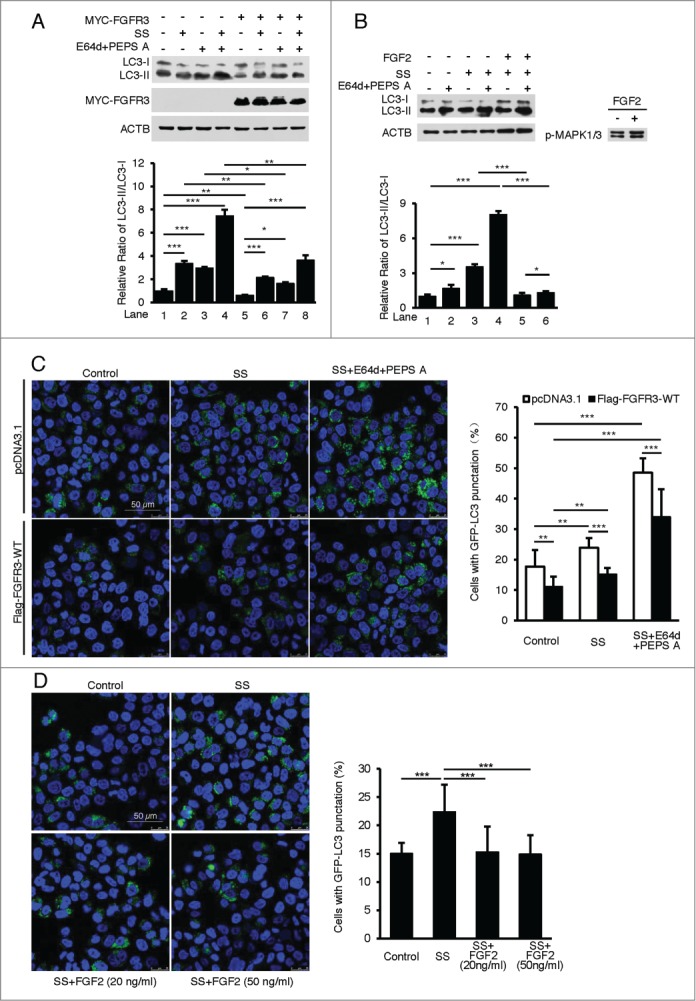
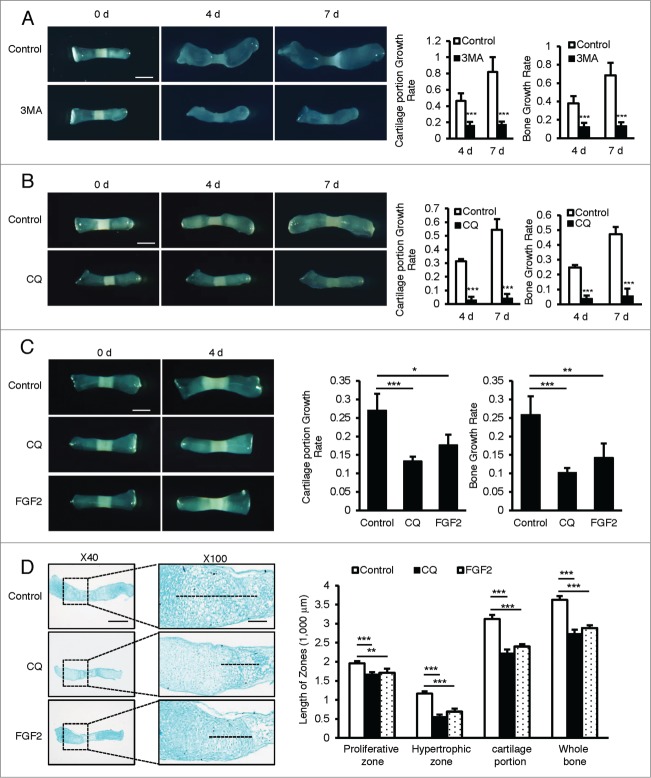
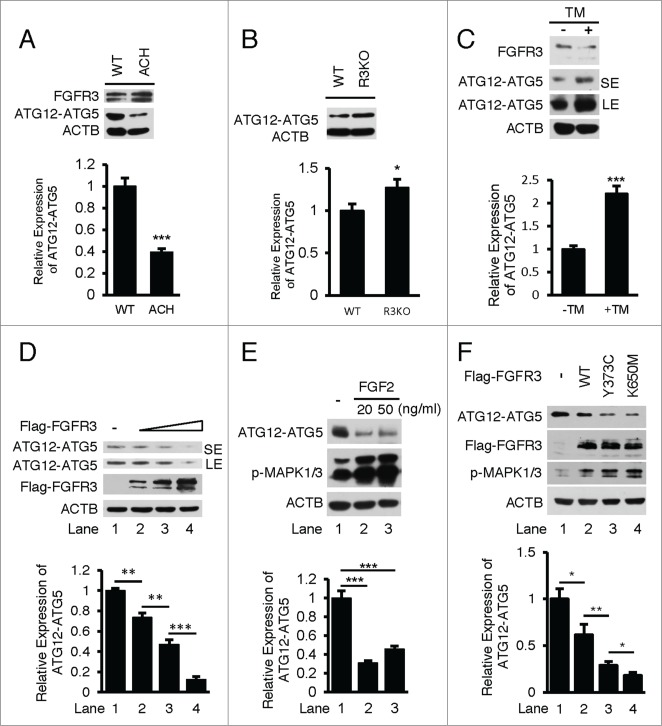
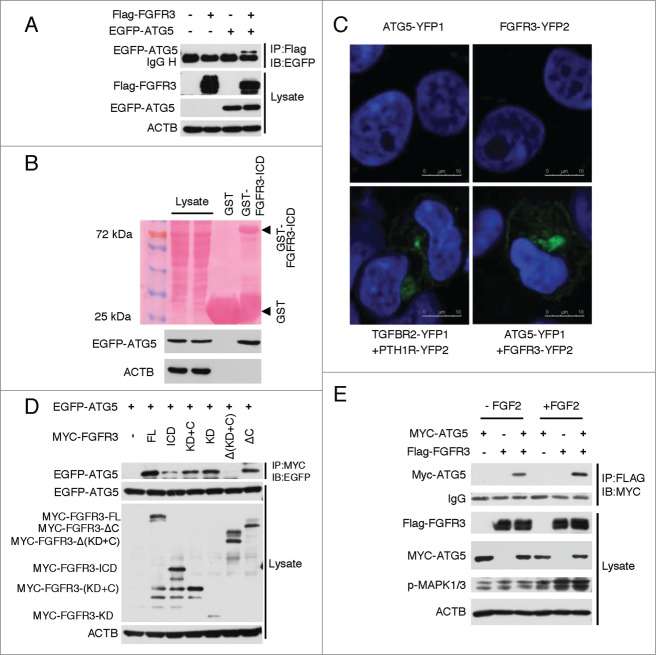
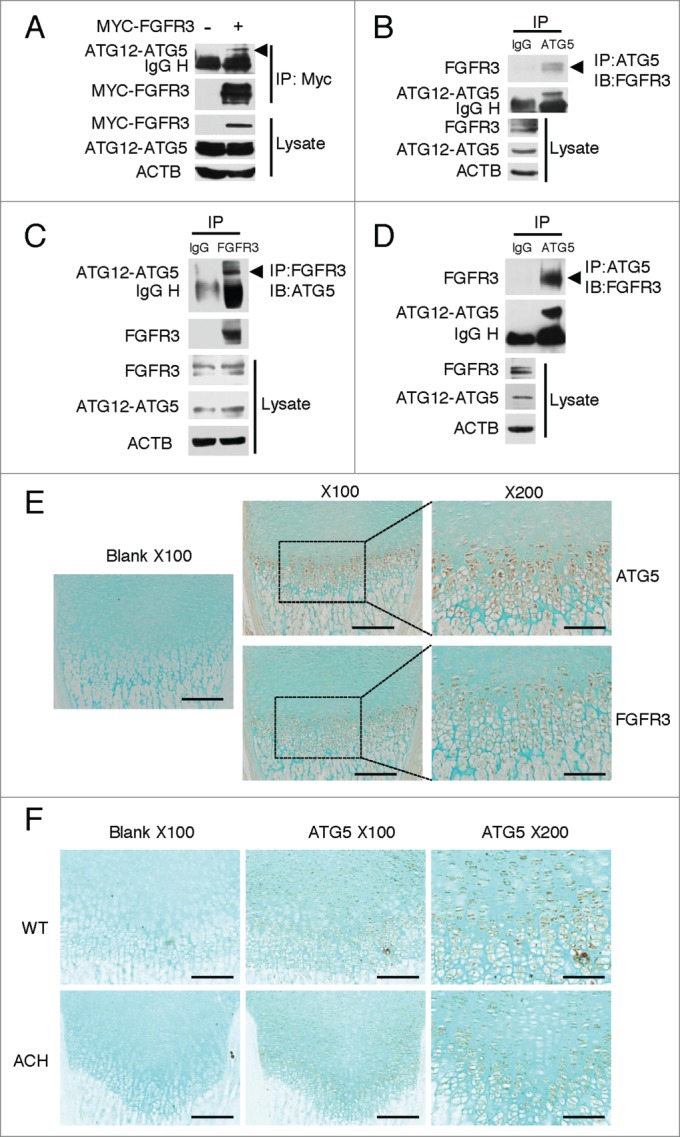
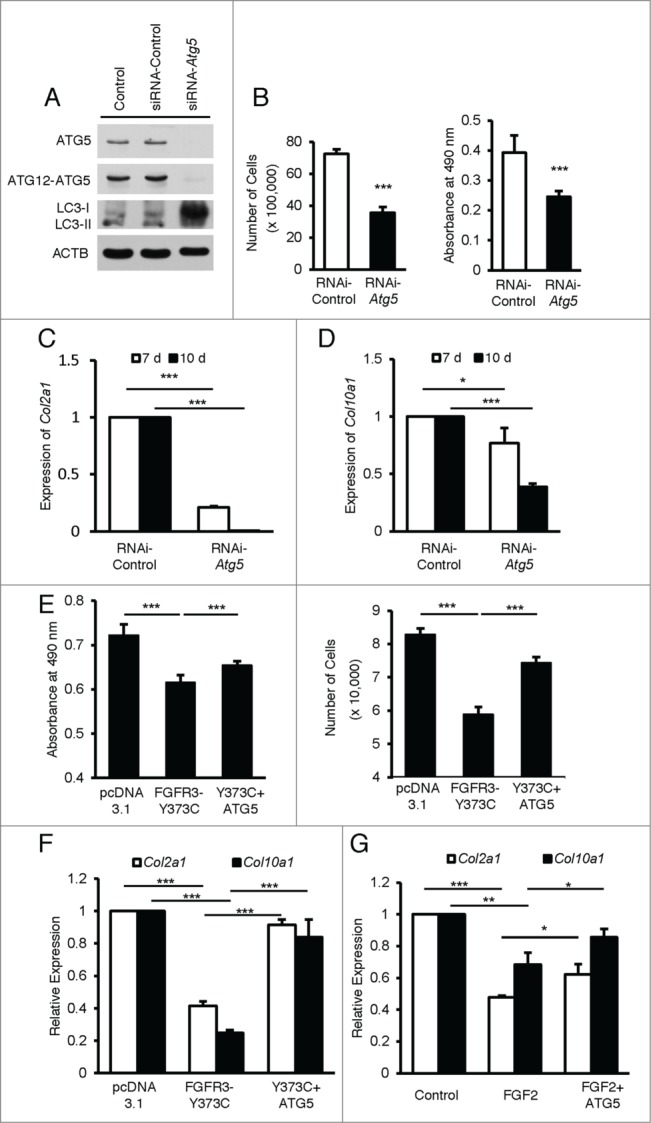
FGFR3 (fibroblast growth factor receptor 3) is a negative regulator of endochondral ossification. Gain-of-function mutations in FGFR3 are responsible for achondroplasia, the most common genetic form of dwarfism in humans. Autophagy, an evolutionarily conserved catabolic process, maintains chondrocyte viability in the growth plate under stress conditions, such as hypoxia and nutritional deficiencies. However, the role of autophagy and its underlying molecular mechanisms in achondroplasia remain elusive. In this study, we found activated FGFR3 signaling inhibited autophagic activity in chondrocytes, both in vivo and in vitro. By employing an embryonic bone culture system, we demonstrated that treatment with autophagy inhibitor 3-MA or chloroquine led to cartilage growth retardation, which mimics the effect of activated-FGFR3 signaling on chondrogenesis. Furthermore, we found that FGFR3 interacted with ATG12-ATG5 conjugate by binding to ATG5. More intriguingly, FGFR3 signaling was found to decrease the protein level of ATG12-ATG5 conjugate. Consistently, using in vitro chondrogenic differentiation assay system, we showed that the ATG12-ATG5 conjugate was essential for the viability and differentiation of chondrocytes. Transient transfection of ATG5 partially rescued FGFR3-mediated inhibition on chondrocyte viability and differentiation. Our findings reveal that FGFR3 inhibits the autophagic activity by decreasing the ATG12-ATG5 conjugate level, which may play an essential role in the pathogenesis of achondroplasia.

Keywords: ATG12–ATG5 conjugate; FGFR3; achondroplasia; autophagy; chondrocytes.


Figures

Figure 1.
Figure 1.
FGFR3 signaling inhibits autophagic activity in chondrocytes in vivo. (A) Immunohistochemistry analysis of LC3 in the growth plates of postnatal d 5 ACH and WT mice. Scale bar: 400 µm (blank, incubation without LC3 antibody), 150 µm (LC3). (B) Western blotting results of the ratio of LC3-II/-I in the primary chondrocytes from ACH, R3KO and R3CKO: CMV-CreERT2 mice. The WT littermates of ACH and R3KO, TM-untreated group were used as controls, respectively. The signal intensities were quantified using software ImageJ (version 1.47). The error bars indicate the standard deviation (n = 3, Student t test, **, P<0.01; ***, P<0.001). (C) Analysis of LC3-immunopositive punctate signals of primary chondrocytes from R3CKO: CMV-CreERT2 mice. The chondrocytes were treated with TM (1 µM) for 48 h, and went through the serum starvation (SS) for 4 h in the presence or absence of E64d and pepstatin A (PEPS A). LC3 punctate signals were analyzed by immunofluorescence assay and recorded using a confocal microscope. Fluorescence-labeled antibody is the Alexa Fluor® 488 goat anti-rabbit IgG. Scale bar: 20 µm. The percentage of cells with LC3 puncta was quantified (n = 3, Student t test. *, P< 0.05; ***, P< 0.001).
Figure 2.
Figure 2.
FGFR3 signaling inhibited autophagic activity in vitro. (A) Overexpression of FGFR3 decreased the ratio of LC3-II/-I in response to serum starvation (SS) for 4 h in the presence or absence of E64d and pepstatin A (PEPS A) in RCS cells. The signal intensity was analyzed (shown in lower panel, n = 3, Student t test, *, P<0.05). (B) Treatment with FGF2 (20 ng/ml, 30 min) significantly blocked the serum starvation-induced (12 h) elevation of endogenous LC3 conversion in ATDC5 cells. The western blotting results were quantitatively analyzed (shown in lower panel, n = 3, Student t test. *, P<0.05; **, P<0.01; ***, P<0.001). (C) Overexpression of FGFR3 reduced the GFP-LC3 puncta under the serum starvation condition in HeLa cells stably expressing GFP-LC3. Scale bar: 50 µm. The percentages of cells with LC3 puncta were counted (shown in the right panel, n = 3, more than 600 cells per experiment were analyzed, Student t test. *, P<0.05; **, P<0.01; ***, P< 0.001). (D) Treatment with FGF2 (20 or 50 ng/ml, 4 h) reduced the GFP-LC3 puncta under serum-starvation conditions (4 h) in HeLa cells stably expressing GFP-LC3. Scale bar: 50 µm. The ratio of positive cells was analyzed (shown in the right panel, n = 3, more than 600 cells per experiment were analyzed, Student t test. ***, P< 0.001).
Figure 3.
Figure 3.
The autophagy inhibitors 3-MA and chloroquine suppressed cartilage development. (A) 3-MA (10 µM) suppressed the growth of cultured metatarsal bones from E18.5 C57Bl/6J mice. Scale bar: 500 µm. The growth rates of cartilage portion and total bone cultured for 4 and 7 d were analyzed (shown in the right panels, n = 6, Student t test. ***, P< 0.001). (B) Chloroquine (CQ, 100 µM) suppressed the growth of cultured metatarsal bones from E18.5 C57Bl/6J mice. Scale bar: 500 µm. The growth rates of cartilage portion and total bone cultured for 4 and 7 d were analyzed (shown in the right panels, n = 6, Student t test, ***, P<0.001). (C) Both chloroquine (CQ, 50 µM) and FGF2 (20 ng/ml) suppressed the growth of cultured metatarsal bones. Scale bar: 500 µm. The growth rates of cartilage portion and total bone cultured for 4 d were analyzed (shown in the right panels, n = 6, Student t test. ***, P<0.001). (D) Alcian blue staining results of cultured metatarsal bones. The black dotted lines indicate the hypertrophic columns. Scale bar: 500 µm (magnification: X40), 100 µm (magnification: X100). Lengths of chondrocyte zones in cultured bones were quantitatively analyzed (shown in the right panels, n = 3, Student t test. *, P<0.05; ***, P< 0.001).
Figure 4.
Figure 4.
FGFR3 decreased the protein level of the ATG12–ATG5 conjugate. (A–C) The results of western blotting of endogenous ATG12–ATG5 conjugate in primary chondrocytes from ACH (A), R3KO (B) and R3CKO: CMV-CreERT2 mice (C). The WT (A, B) littermates and TM-untreated (C) mice were used as controls. The signal intensities were quantified (shown in the lower panels, n = 3, Student t test. ***, P<0.001). (D) Increasing amount of FGFR3 decreased the protein level of endogenous ATG12–ATG5 conjugate in RCS cells (quantitative data on LE blot were shown in the lower panel, n = 3, Student t test. **, P<0.01; ***, P<0.001). (E) Treatment with FGF2 (20 or 50 ng/ml, 4 h) decreased endogenous ATG12–ATG5 conjugate level in ATDC5 cells (quantitative data were shown in the lower panel; n = 3, Student t test. ***, P < 0.001). (E) Different forms of FGFR3 (WT, Y373C and K650M) reduced endogenous ATG12–ATG5 conjugate level in RCS cells (quantitative data were shown in the lower panel; n = 3, Student t test. *, P<0.05, **, P<0.01; ***, P<0.001). LE, long-time exposure; SE, short-time exposure.
Figure 5.
Figure 5.
FGFR3 interacted with ATG5 in vitro. (A) Coimmunoprecipitation (CoIP) results of Flag-FGFR3 and EGFP-ATG5 in 293T cells. (B) GST affinity isolation results of GST-FGFR3-ICD associated with EGFP-ATG5 expressed in 293T cells. (C) YFP-PCA analysis of the interaction of ATG5 with FGFR3 in HEK293 cells. ATG5-YFP1 or FGFR3-YFP2 alone is the negative control and association of TGFBR2 and PTH1R with the treatment of PTH for 5 min as the positive control. Scale bars: 10 µm. (D) Mapping of the FGFR3 domain to interact ATG5. A series of deletion mutants of FGFR3 were expressed together with EGFP-ATG5 in 293T cells, CoIP and western blotting were performed as indicated. (E) FGF2 treatment enhanced the interaction between FGFR3 and ATG5. CoIP results of FGFR3 and ATG5 with the treatment of FGF2 (20 ng/ml, 30 min).
Figure 6.
Figure 6.
FGFR3 interacted with ATG12–ATG5 conjugate in cells and in vivo. (A) Overexpression FGFR3 interacted with endogenous ATG12–ATG5 in HeLa cells. CoIP analysis of overexpressed Myc-FGFR3 and endogenous ATG12–ATG5 with antibody as indicated. The arrow shows the specific band. (B) Association of endogenous FGFR3 and ATG12–ATG5 in HeLa cells. (C, D) CoIP analysis of endogenous FGFR3 and ATG12–ATG5 in primary chondrocytes form C57Bl/6J mice. IP was performed with rabbit anti-FGFR3 antibody followed by immunoblotting with rabbit anti- ATG12–ATG5 antibody (C), or conversely, IP was performed with rabbit anti-ATG12–ATG5 antibody followed by immunoblotting with rabbit anti-FGFR3 antibody (D). (E) The expression of ATG5 and FGFR3 in the growth plate. Immunohistochemistry analysis for ATG5 and FGFR3 was performed in the growth plate of C57Bl/6J mice tibias. (F) The expression of ATG5 in the growth plate of ACH mice. Immunohistochemistry analysis for ATG5 was done in the growth plate of ACH mice tibias, and that of the WT littermates were used as control. Scale bar: 200 µm (magnification: × 100), Scale bar: 100 µm (magnification: × 200).
Figure 7.
Figure 7.
The ATG12–ATG5 conjugate was essential for the chondrogenesis and enhanced function of the ATG12–ATG5 conjugate moderated the profound inhibition on the chondrocyte viability and differentiation by FGFR3. (A) Knocking down Atg5 in ATDC5 cells decreased the ATG5 and ATG12–ATG5 conjugate protein level, and almost completely blocked the conversion of endogenous LC3. (B) Knocking down Atg5 reduced the viability of ATDC5 chondrocytes. The cell counting (n = 3) and MTT assay (n = 6) were performed for 48 h (Student t test. ***, P<0.001). (C, D) Knocking down Atg5 decreased the mRNA level of chondrocyte differentiation markers, such as Col2a1 (C) and Col10a1 (D) in ITS-induced ATDC5 cells (7 d or 10 d, n = 3, Student t test. *, P<0.05; ***, P<0.001). (E) Overexpression of ATG5 partially retarded FGFR3Y373C mediated suppression of RCS chondrocytes viability. The MTT assay (n = 6) and cell counting (n = 3) were performed as indicated (Student t test. ***, P<0.001). (F) Overexpression of ATG5 partially retarded FGFR3Y373C mediated suppression of the mRNA level of Col2a1 and Col10a1 in ITS-induced ATDC5 cells (4 d, n = 3, Student t test. ***, P< 0.001). (G) Overexpression of ATG5 retarded FGF2 (20 ng/ml) treatment mediated suppression of mRNA level of Col2a1 and Col10a1 in ITS-induced ATDC5 cells (transfected cells were induced by ITS with or without the FGF2 treatment for 4 d, n = 3, Student t test. *, P<0.05; **, P < 0.01; ***, P< 0.001).

Similar articles

Cited by

References

    1. Long F, Ornitz DM. Development of the endochondral skeleton. Cold Spring Harb Perspect Biol 2013; 5:a008334; PMID:23284041; http://dx.doi.org/10.1101/cshperspect.a008334 - DOI - PMC - PubMed
    1. Erlebacher A, Filvaroff EH, Gitelman SE, Derynck R. Toward a molecular understanding of skeletal development. Cell 1995; 80:371-8; PMID:7859279; http://dx.doi.org/10.1016/0092-8674(95)90487-5 - DOI - PubMed
    1. De Luca F, Baron J. Control of bone growth by fibroblast growth factors. Trends Endocrinol Metab 1999; 10:61-5; PMID:10322396; http://dx.doi.org/10.1016/S1043-2760(98)00120-9 - DOI - PubMed
    1. Bonaventure J, Rousseau F, Legeai-Mallet L, Le Merrer M, Munnich A, Maroteaux P. Common mutations in the gene encoding fibroblast growth factor receptor 3 account for achondroplasia, hypochondroplasia and thanatophoric dysplasia. Acta Paediatr Suppl 1996; 417:33-8; PMID:9055906; http://dx.doi.org/10.1111/j.1651-2227.1996.tb14291.x - DOI - PubMed
    1. Rousseau F, Bonaventure J, Legeai-Mallet L, Pelet A, Rozet JM, Maroteaux P, Le Merrer M, Munnich A. Mutations in the gene encoding fibroblast growth factor receptor-3 in achondroplasia. Nature 1994; 371:252-4; PMID:8078586; http://dx.doi.org/10.1038/371252a0 - DOI - PubMed