

Fully Automated Quantitative Estimation of Volumetric Breast Density from Digital Breast Tomosynthesis Images: Preliminary Results and Comparison with Digital Mammography and MR Imaging
- PMID: 26491909
- PMCID: PMC4819897
- DOI: 10.1148/radiol.2015150277
Fully Automated Quantitative Estimation of Volumetric Breast Density from Digital Breast Tomosynthesis Images: Preliminary Results and Comparison with Digital Mammography and MR Imaging
Abstract
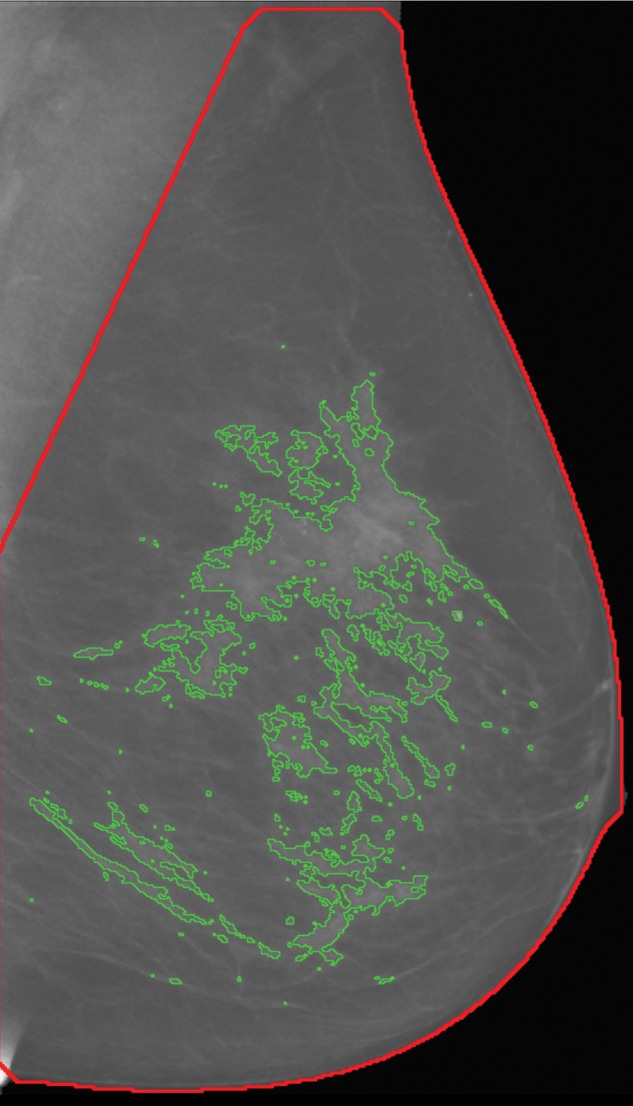
Purpose: To assess a fully automated method for volumetric breast density (VBD) estimation in digital breast tomosynthesis (DBT) and to compare the findings with those of full-field digital mammography (FFDM) and magnetic resonance (MR) imaging.
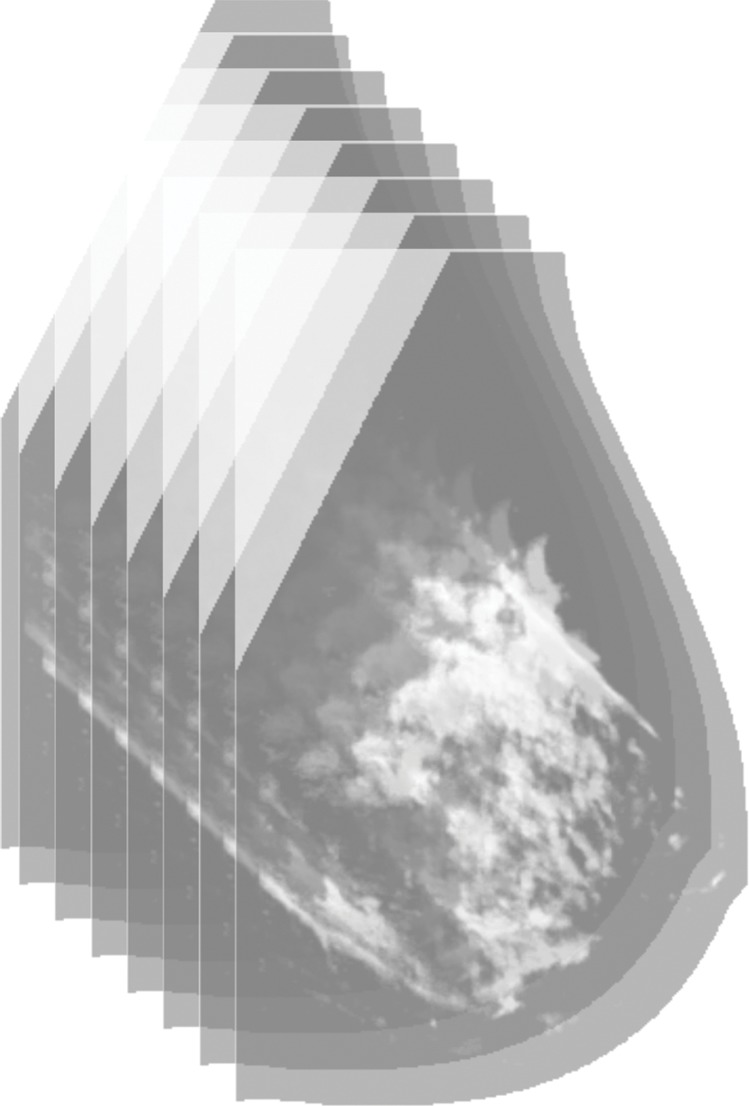
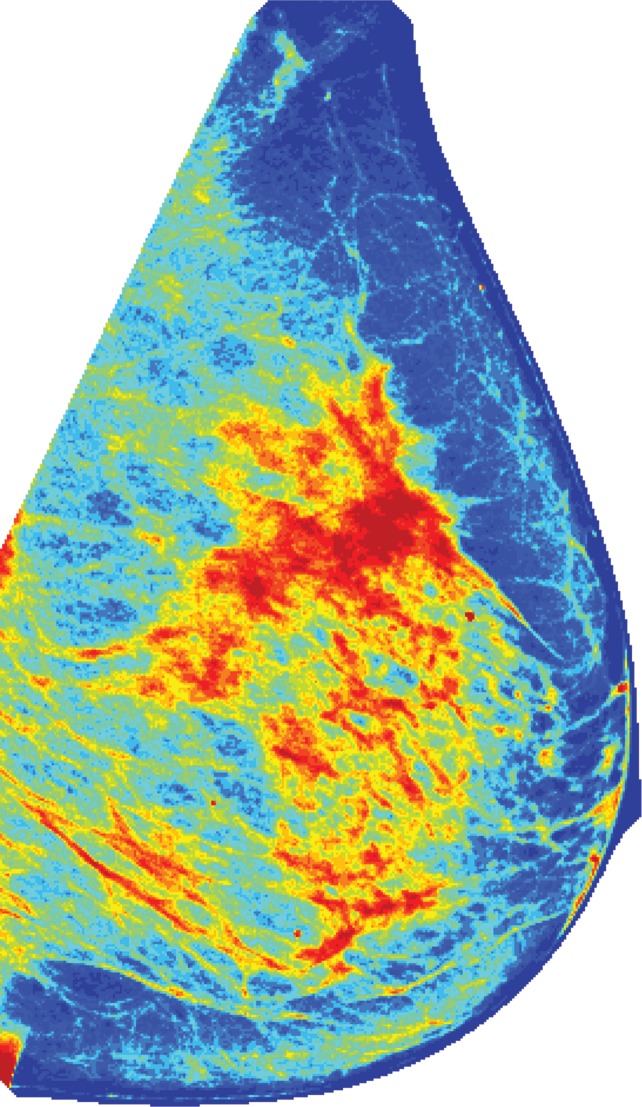
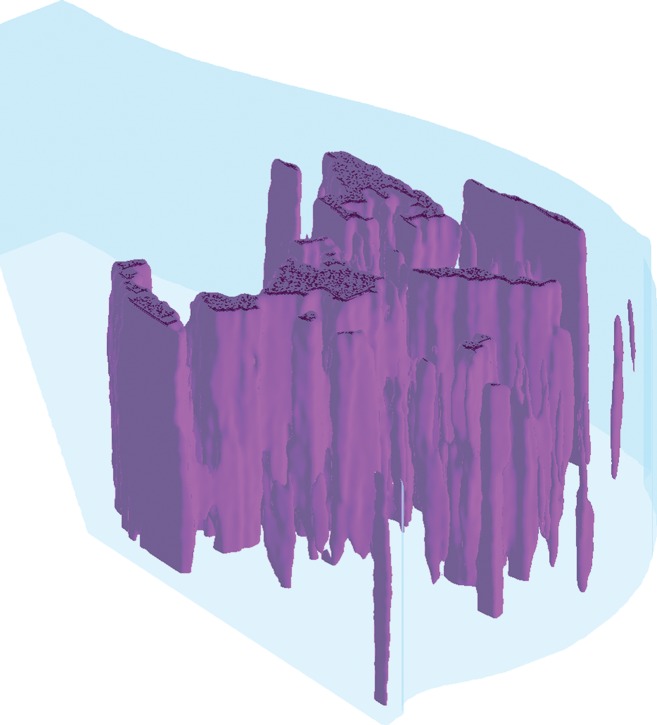
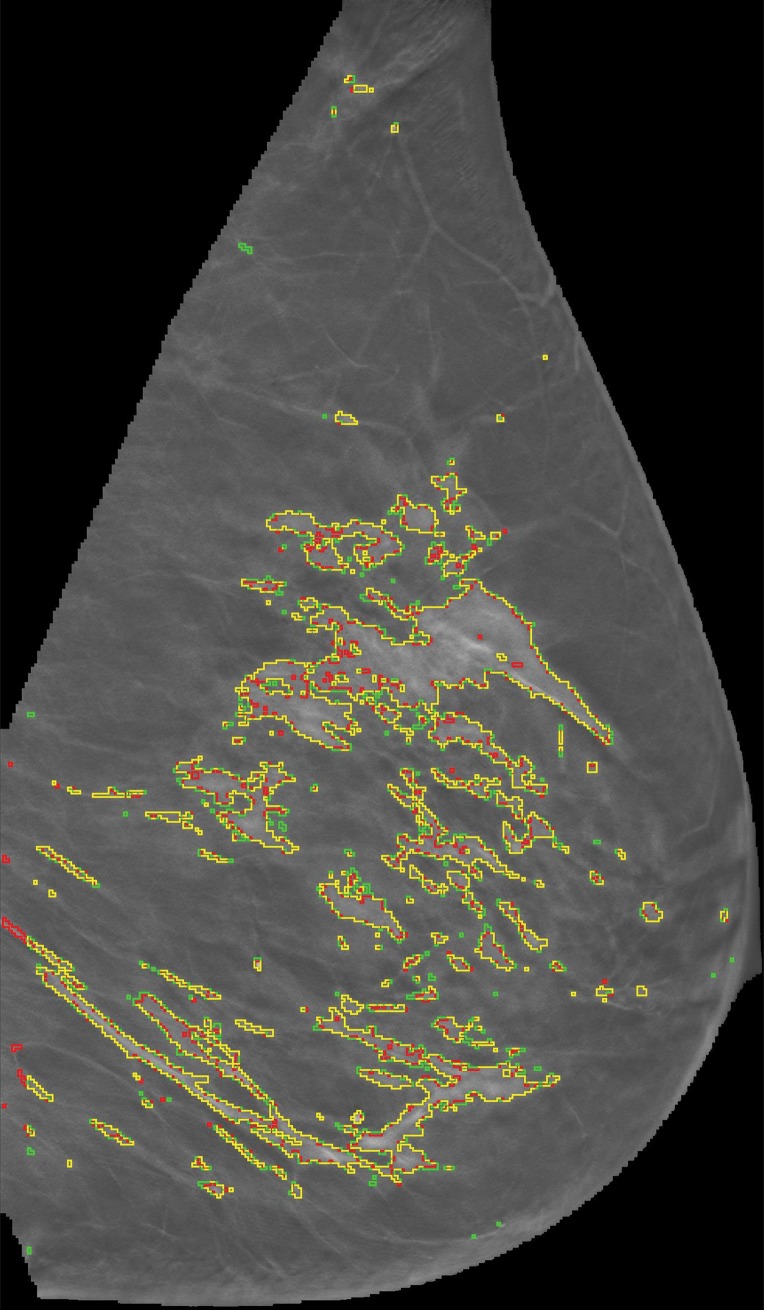
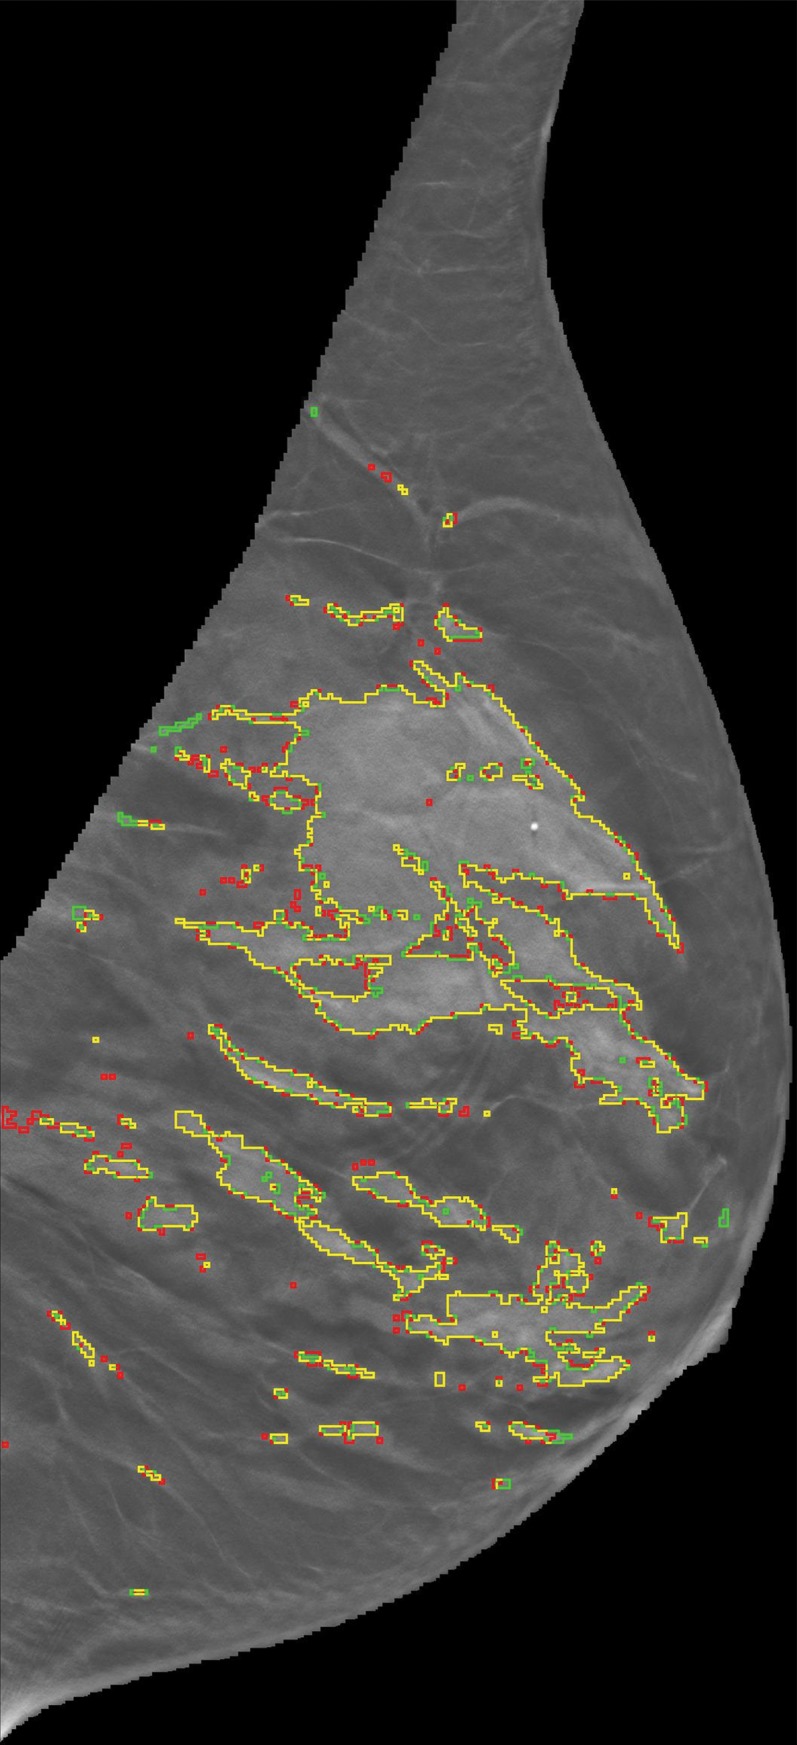
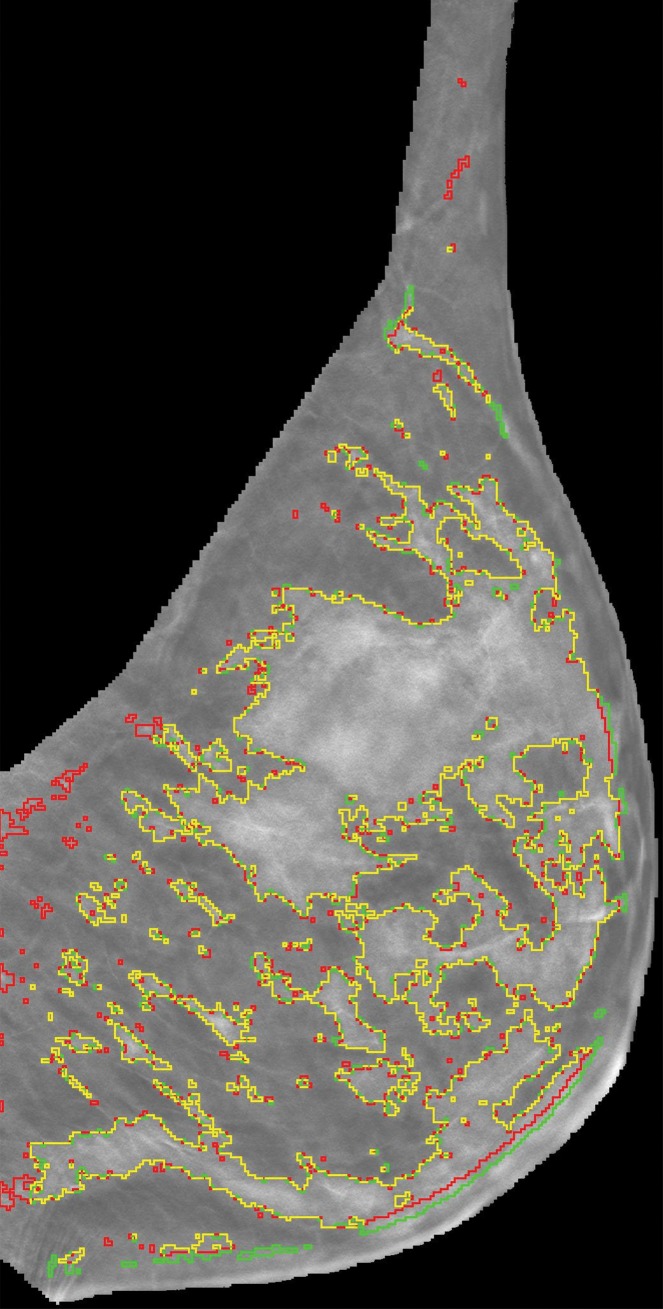
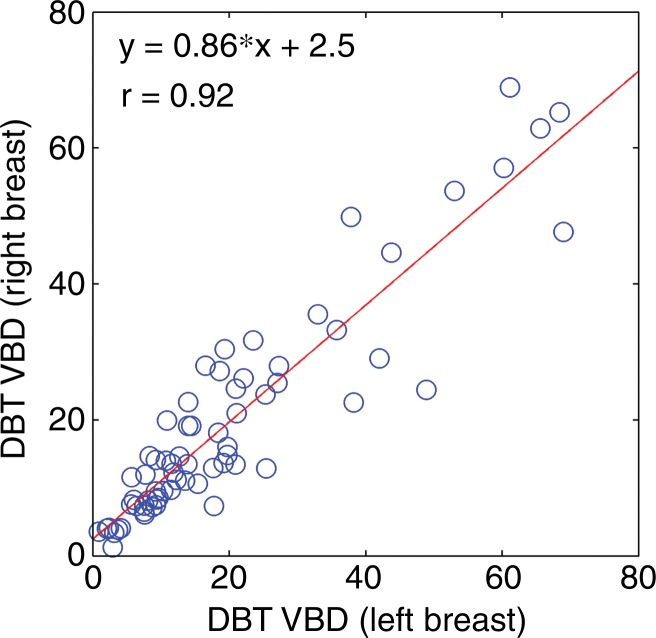
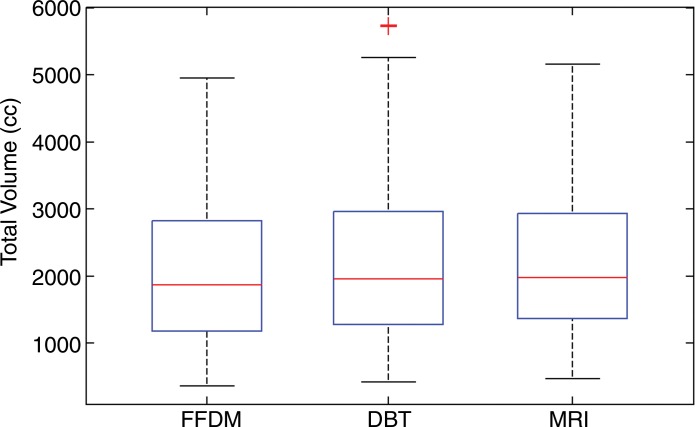
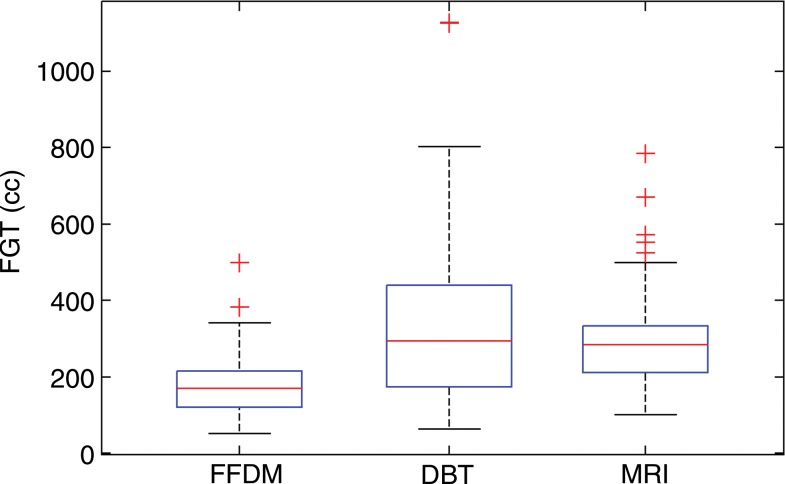
Materials and methods: Bilateral DBT images, FFDM images, and sagittal breast MR images were retrospectively collected from 68 women who underwent breast cancer screening from October 2011 to September 2012 with institutional review board-approved, HIPAA-compliant protocols. A fully automated computer algorithm was developed for quantitative estimation of VBD from DBT images. FFDM images were processed with U.S. Food and Drug Administration-cleared software, and the MR images were processed with a previously validated automated algorithm to obtain corresponding VBD estimates. Pearson correlation and analysis of variance with Tukey-Kramer post hoc correction were used to compare the multimodality VBD estimates.
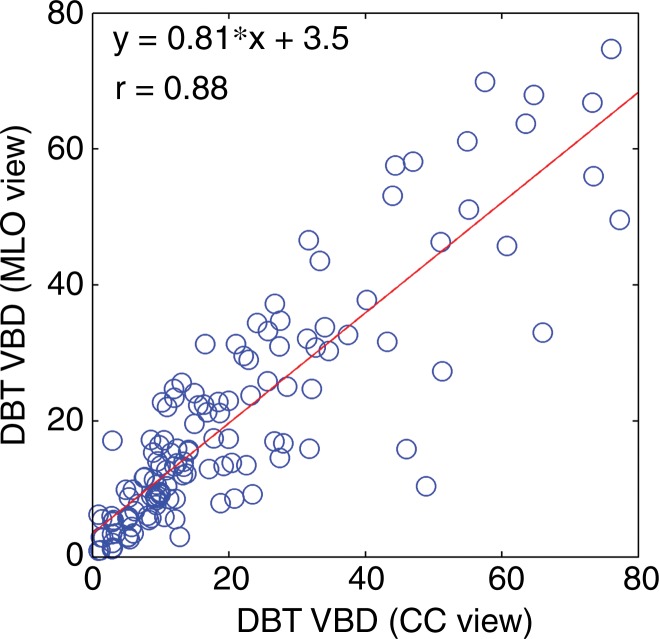
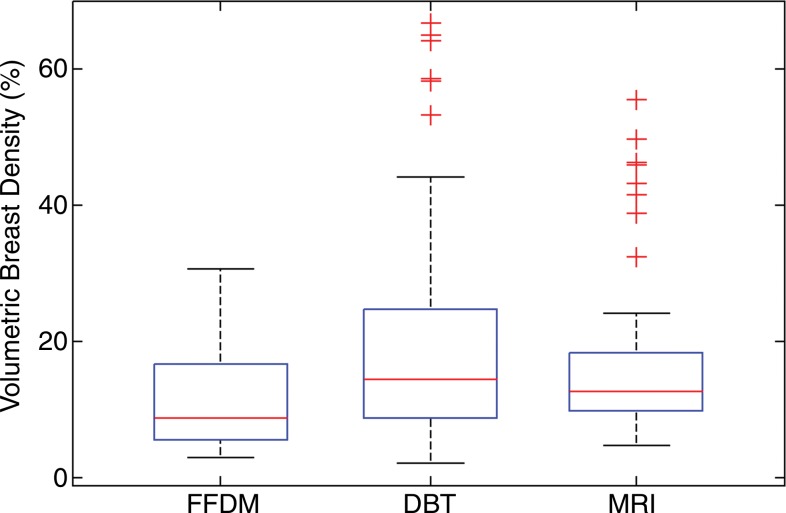
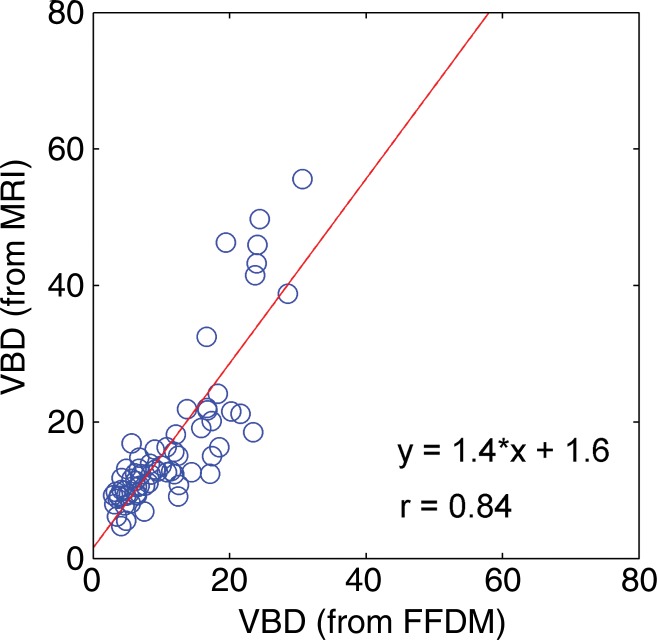
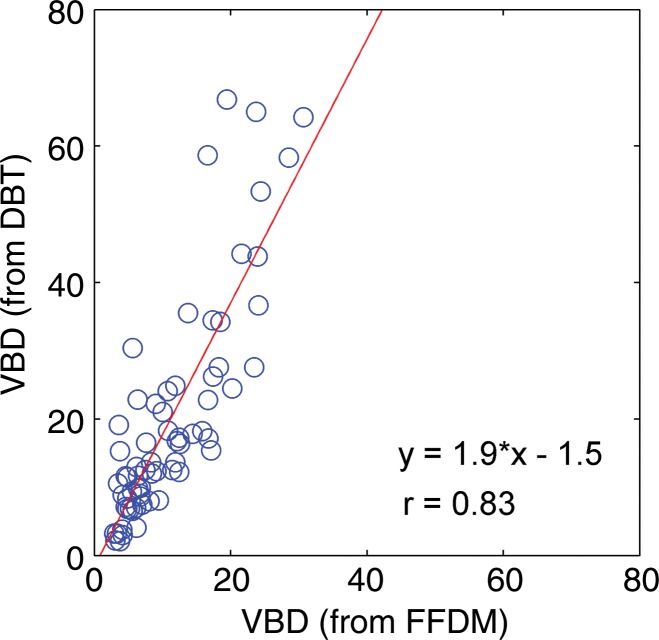
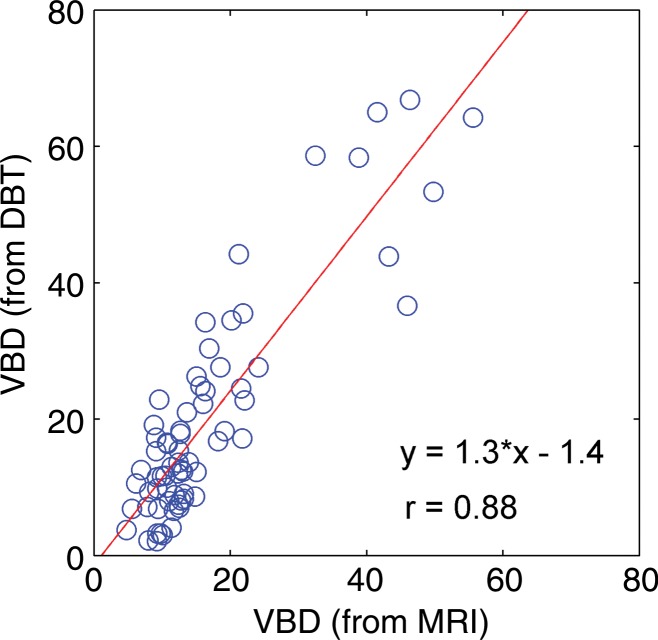
Results: Estimates of VBD from DBT were significantly correlated with FFDM-based and MR imaging-based estimates with r = 0.83 (95% confidence interval [CI]: 0.74, 0.90) and r = 0.88 (95% CI: 0.82, 0.93), respectively (P < .001). The corresponding correlation between FFDM and MR imaging was r = 0.84 (95% CI: 0.76, 0.90). However, statistically significant differences after post hoc correction (α = 0.05) were found among VBD estimates from FFDM (mean ± standard deviation, 11.1% ± 7.0) relative to MR imaging (16.6% ± 11.2) and DBT (19.8% ± 16.2). Differences between VDB estimates from DBT and MR imaging were not significant (P = .26).
Conclusion: Fully automated VBD estimates from DBT, FFDM, and MR imaging are strongly correlated but show statistically significant differences. Therefore, absolute differences in VBD between FFDM, DBT, and MR imaging should be considered in breast cancer risk assessment.
Figures
Similar articles
-
Mammographic density estimation: one-to-one comparison of digital mammography and digital breast tomosynthesis using fully automated software.Eur Radiol. 2012 Jun;22(6):1265-70. doi: 10.1007/s00330-012-2380-y. Epub 2012 Feb 24. Eur Radiol. 2012. PMID: 22358426
-
Automated volumetric breast density estimation out of digital breast tomosynthesis data: feasibility study of a new software version.Springerplus. 2016 Jun 18;5(1):780. doi: 10.1186/s40064-016-2519-4. eCollection 2016. Springerplus. 2016. PMID: 27386266 Free PMC article.
-
Automated Breast Density Computation in Digital Mammography and Digital Breast Tomosynthesis: Influence on Mean Glandular Dose and BIRADS Density Categorization.Acad Radiol. 2017 Jul;24(7):802-810. doi: 10.1016/j.acra.2017.01.011. Epub 2017 Feb 14. Acad Radiol. 2017. PMID: 28214227
-
Review of radiation dose estimates in digital breast tomosynthesis relative to those in two-view full-field digital mammography.Breast. 2015 Apr;24(2):93-9. doi: 10.1016/j.breast.2014.12.002. Epub 2014 Dec 29. Breast. 2015. PMID: 25554018 Free PMC article. Review.
-
Digital breast tomosynthesis in one or two views as a replacement or adjunct technique to full-field digital mammography.Radiat Prot Dosimetry. 2015 Jul;165(1-4):314-20. doi: 10.1093/rpd/ncv078. Epub 2015 Apr 5. Radiat Prot Dosimetry. 2015. PMID: 25848107 Review.
Cited by
-
A Multisite Study of a Breast Density Deep Learning Model for Full-Field Digital Mammography and Synthetic Mammography.Radiol Artif Intell. 2020 Nov 4;3(1):e200015. doi: 10.1148/ryai.2020200015. eCollection 2021 Jan. Radiol Artif Intell. 2020. PMID: 33937850 Free PMC article.
-
Comparison between software volumetric breast density estimates in breast tomosynthesis and digital mammography images in a large public screening cohort.Eur Radiol. 2019 Jan;29(1):330-336. doi: 10.1007/s00330-018-5582-0. Epub 2018 Jun 25. Eur Radiol. 2019. PMID: 29943180 Free PMC article.
-
Qualitative Versus Quantitative Mammographic Breast Density Assessment: Applications for the US and Abroad.Diagnostics (Basel). 2017 May 31;7(2):30. doi: 10.3390/diagnostics7020030. Diagnostics (Basel). 2017. PMID: 28561776 Free PMC article. Review.
-
Fully Automated Volumetric Breast Density Estimation from Digital Breast Tomosynthesis.Radiology. 2021 Dec;301(3):561-568. doi: 10.1148/radiol.2021210190. Epub 2021 Sep 14. Radiology. 2021. PMID: 34519572 Free PMC article.
-
Impact of Using Uniform Attenuation Coefficients for Heterogeneously Dense Breasts in a Dedicated Breast PET/X-ray Scanner.IEEE Trans Radiat Plasma Med Sci. 2020 Sep;4(5):585-593. doi: 10.1109/trpms.2020.2991120. Epub 2020 Apr 29. IEEE Trans Radiat Plasma Med Sci. 2020. PMID: 33163753 Free PMC article.
References
-
- Boyd NF, Guo H, Martin LJ, et al. . Mammographic density and the risk and detection of breast cancer. N Engl J Med 2007;356(3):227–236. - PubMed
-
- McCormack VA, dos Santos Silva I. Breast density and parenchymal patterns as markers of breast cancer risk: a meta-analysis. Cancer Epidemiol Biomarkers Prev 2006;15(6):1159–1169. - PubMed
-
- Harvey JA, Yaffe MJ, D’Orsi C, Sickles EA. Density and breast cancer risk. Radiology 2013;267(2):657–658. - PubMed
-
- Price ER, Hargreaves J, Lipson JA, et al. . The California breast density information group: a collaborative response to the issues of breast density, breast cancer risk, and breast density notification legislation. Radiology 2013;269(3):887–892. - PubMed
Publication types
MeSH terms
Grants and funding
LinkOut - more resources
Full Text Sources
Other Literature Sources
Medical
Molecular Biology Databases
