. 2015 Oct 22;11(10):e1004563.
doi: 10.1371/journal.pcbi.1004563. eCollection 2015 Oct.

Intracellular Information Processing through Encoding and Decoding of Dynamic Signaling Features

Affiliations

Intracellular Information Processing through Encoding and Decoding of Dynamic Signaling Features

Hirenkumar K Makadia et al. PLoS Comput Biol. .

Abstract

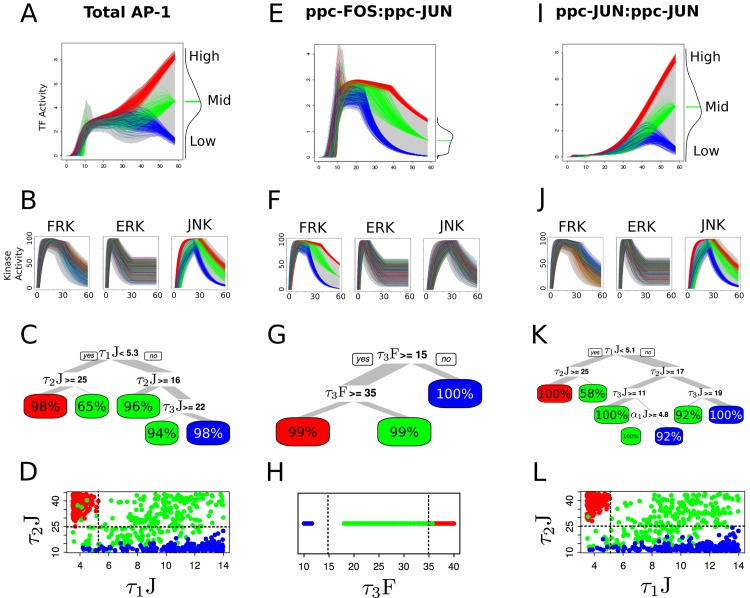
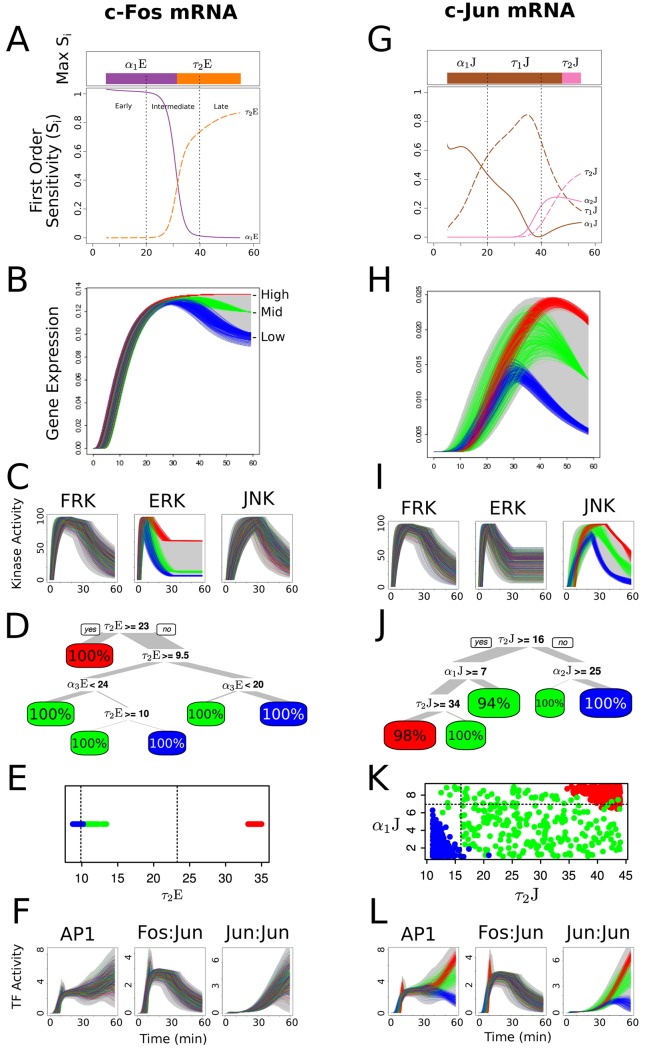
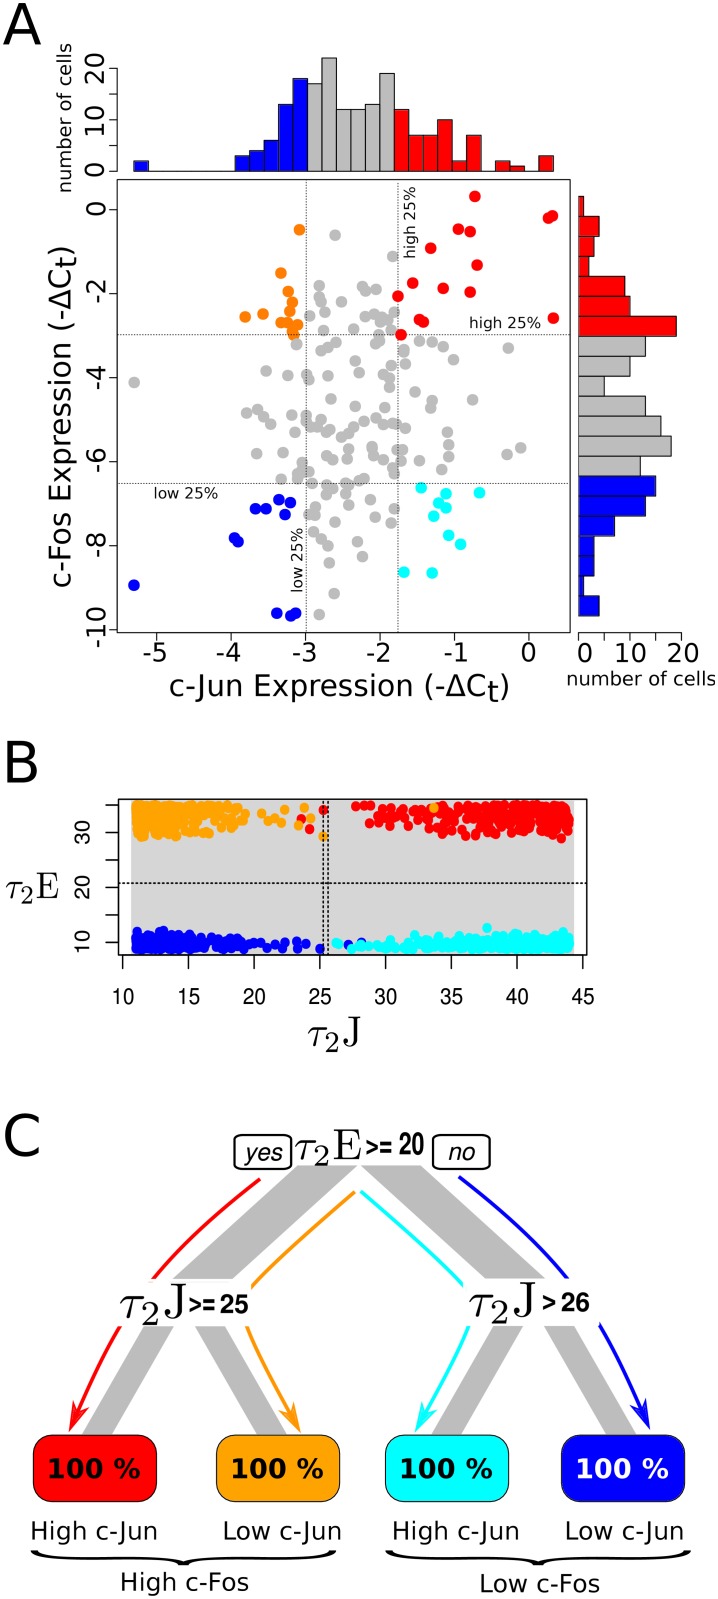
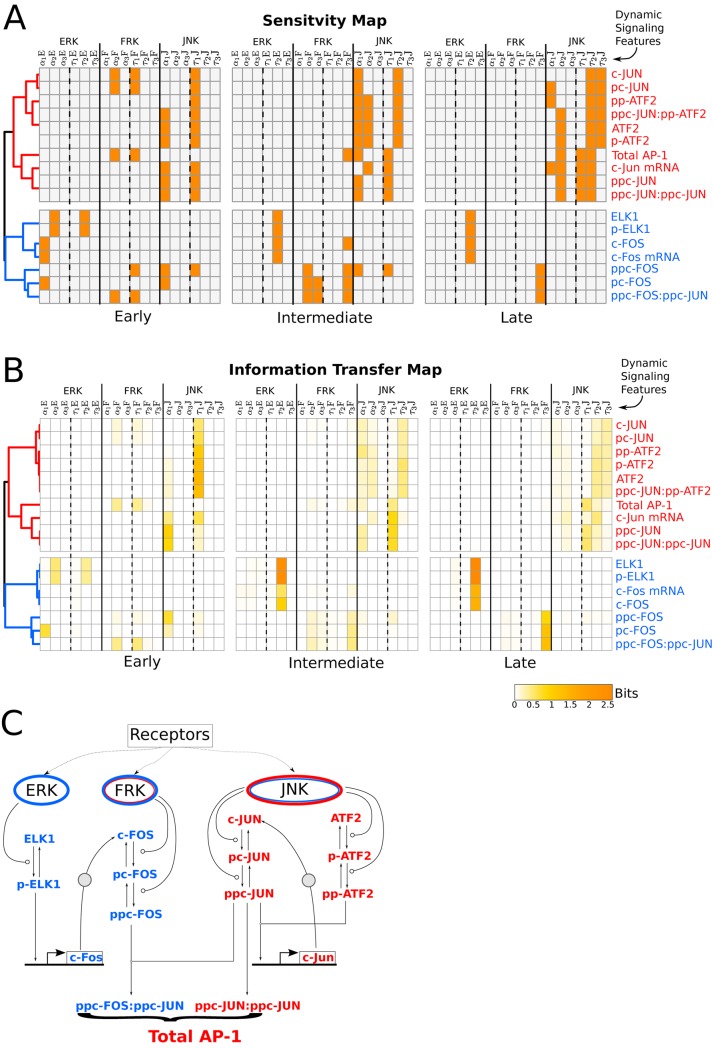
Cell signaling dynamics and transcriptional regulatory activities are variable within specific cell types responding to an identical stimulus. In addition to studying the network interactions, there is much interest in utilizing single cell scale data to elucidate the non-random aspects of the variability involved in cellular decision making. Previous studies have considered the information transfer between the signaling and transcriptional domains based on an instantaneous relationship between the molecular activities. These studies predict a limited binary on/off encoding mechanism which underestimates the complexity of biological information processing, and hence the utility of single cell resolution data. Here we pursue a novel strategy that reformulates the information transfer problem as involving dynamic features of signaling rather than molecular abundances. We pursue a computational approach to test if and how the transcriptional regulatory activity patterns can be informative of the temporal history of signaling. Our analysis reveals (1) the dynamic features of signaling that significantly alter transcriptional regulatory patterns (encoding), and (2) the temporal history of signaling that can be inferred from single cell scale snapshots of transcriptional activity (decoding). Immediate early gene expression patterns were informative of signaling peak retention kinetics, whereas transcription factor activity patterns were informative of activation and deactivation kinetics of signaling. Moreover, the information processing aspects varied across the network, with each component encoding a selective subset of the dynamic signaling features. We developed novel sensitivity and information transfer maps to unravel the dynamic multiplexing of signaling features at each of these network components. Unsupervised clustering of the maps revealed two groups that aligned with network motifs distinguished by transcriptional feedforward vs feedback interactions. Our new computational methodology impacts the single cell scale experiments by identifying downstream snapshot measures required for inferring specific dynamical features of upstream signals involved in the regulation of cellular responses.


Conflict of interest statement

The authors have declared that no competing interests exist.

Figures

Fig 1
Fig 1. Integrated model of signaling dynamics and gene regulatory network.
Comparison of the salient features of a modern communication network (left) to a biochemical signaling and gene regulatory network (right). The functional information in a receptor stimulus is encoded in temporal features of signals in a similar manner as in communication networks, where information is encoded in characteristic features (such as amplitude, phase, frequency, etc.) of the signals. These encoded signals are transmitted over the regulatory network (or channel) and decoded downstream (or receiver end).
Fig 2
Fig 2. Functional information encoding through dynamical signaling features.
(A) Illustration showing independent temporal features of dynamics of a transient signaling kinase in the phases of delay, activation, peak retention and deactivation kinetics. (See Methods and Table 1 for details) (B, C and D) Simultaneous variability in all six temporal features encompasses (gray region in the plot) the observed experimental variations in ERK, FRK and JNK activation (red error bars), respectively. The gray region is based on a total of 100,000 simultaneous variations in all eighteen signaling features, generated using a differential variation schema reported in Table 1. The red points and error bars in the plots show experimental data from neuronal cultures incubated with Angiotensin II (100 nM) to activate AT1R signaling for 0–60 min at 37°C. Time course data for ERK is taken from [93], whereas for FRK and JNK time course observations are from [94]. The extended figure on the right of the JNK plot illustrates a subset of 100,000 random profiles (colored lines) filling the gray region and bounded within the red error bars. (E,F,G, H and I) Simulations results from 0 to 60 minutes for each unique combination of three signaling profiles (100,000 random samples in total) for downstream responses of immediate early genes c-Jun and c-Fos, and transcription factors ppc-JUN:ppc-JUN, ppc-FOS:ppc-JUN and Total AP-1. Experimental data for Total AP-1 time course observations are taken from [46].
Fig 3
Fig 3. Transcriptional regulatory activity is controlled by initial delay and activation kinetics of the signaling dynamics.
(A) Density plot for 100,000 simulation results at each time point from 0 to 60 minutes for transcription factors ppc-FOS:ppc-JUN, ppc-JUN:ppc-JUN and Total AP-1. (B) Variance based first order sensitivity coefficients (S i) of signaling features at each time point from 5 to 55 min as line plots to ppc-FOS:ppc-JUN, ppc-JUN:ppc-JUN and Total AP-1, respectively. The first and last five minutes of S i’s are not shown due to the expected instabilities in numerical estimation when dealing with near-zero values. Maximum S i at each timepoint is shown as the color bar on top of each line plots. Refer to Table 1 for details of the signaling feature symbols.
Fig 4
Fig 4. Information transduced by signaling features to downstream transcription factors.
(A) Mutual information between each signaling feature at the snapshot measures of early (20 min as white), intermediate (40 min as gray) and late (58 min as black) phases to downstream transcription factor responses for ppc-FOS:ppc-JUN. (B) Mutual Information between signaling feature and ppc-JUN:ppc-JUN at different snapshot measures. (C) Mutual information between signaling features and Total AP-1. Only FRK and JNK signaling features transferred information to ppc-FOS:ppc-JUN and ppc-JUN:ppc-JUN, respectively, whereas features of both FRK and JNK signals transferred information to Total AP-1.
Fig 5
Fig 5. Combination of activation and deactivation kinetics of signaling dynamics stratify late response transcription factor phenotypes.
(A) Late response (58 min) phenotypes for Total AP-1 transcription factor (TF) shown as High, Mid, and Low, represented by red, green, and blue colors, respectively. The red and blue phenotypes were selected from upper and lower margins of the distribution at the late time point, respectively (distribution is illustrated on the right side of the figure), and mid phenotype profiles where selected from the median region of the distribution. The first 250 profiles are shown for each response TF phenotype, selected from their representative statistical regions. The gray background corresponds to spanning of the 100,000 simulations resulting from a dense simultaneous randomization of signaling features (see Methods section for details). (B) The corresponding upstream signaling kinase profiles for FRK, ERK and JNK responsible for shaping the Total AP-1 response TF phenotypes displayed in A. (C) Decision tree displaying the combination rules of signaling features essential to stratify late Total AP-1 downstream response TF phenotypes (red, green and blue). The tree root node represents the most dominant feature, the next branch nodes represent relatively less dominant features, and so on. The width of the tree branch represents the number of cells, and the percentage in each leaf constitutes the proportion of those cells belonging to the respective phenotype, represented via red (High), green (Mid) or blue (Low) color. (D) Scatter plot of the first two dominant signaling features distinctively separating the three Total AP-1 phenotypes in feature-space, shown through dotted lines. These dotted lines are the classifiers estimated by the root, and the first significant branch of the decision tree in C. τ 2J and τ 1J splices out Total AP-1 late response phenotypes for Total AP-1. (E) Late response phenotypes for ppc-FOS:ppc-JUN TF, shown as red, green and blue. See A for details. (F) The corresponding 250 signaling kinase profiles which shaped ppc-FOS:ppc-JUN TF phenotypes. (G) Decision tree displaying the combination rules of signaling features necessary to stratify the late ppc-FOS:ppc-JUN downstream responses. See C for figure details. (H) Plot showing dominant signaling feature, τ 3F, distinctively separating three ppc-FOS:ppc-JUN phenotypes. (I) Late response phenotypes for late ppc-JUN:ppc-JUN response, shown as red, green and blue, respectively. See A for figure details. (J) The corresponding signaling profiles that shaped ppc-JUN:ppc-JUN TF phenotypes. (K) Decision tree displaying the combination rules of signaling features necessary to splice late ppc-JUN:ppc-JUN downstream phenotypes. See C for details. (L) Scatter plot of the first two dominant signaling features, τ 1J and τ 2J distinctively separating three ppc-JUN:ppc-JUN phenotypes in their feature-space, shown via dotted lines.
Fig 6
Fig 6. Activation kinetics of peak retention controls the late response of the immediate early gene expression dynamics.
(A) First order sensitivity indices at each timepoint from 5 to 55 min for c-Fos mRNA. See Fig 3B for details. (B) High, Mid and Low c-Fos immediate gene expression (IEG) phenotypes at late phase of the dynamics as shown by red, green and blue colors, respectively. See Fig 5A for details. (C) The corresponding upstream signaling kinase profiles for FRK, ERK and JNK responsible for shaping the c-Fos IEG phenotypes displayed in B. (D) Decision tree displaying the combination rules of signaling features necessary to stratify the late c-Fos IEG downstream responses. See Fig 5C for details. (E) Plot of the only dominant signaling feature, τ 2E, distinctively separating three c-Fos IEG phenotypes. (F) The corresponding downstream transcription factor profiles for Total AP-1, ppc-FOS:ppc-JUN and ppc-JUN:ppc-JUN shaped by c-Fos IEG phenotypes displayed in B. (G) First order sensitivity indices to c-Jun mRNA. (H) High, Mid and Low c-Jun IEG phenotypes at late phase of the dynamics (I) The corresponding upstream signaling kinase profiles for FRK, ERK and JNK responsible for shaping the c-Jun IEG phenotypes, displayed in H. (J) Decision tree displaying the combination rules of signaling features necessary to stratify the late c-Jun IEG. (K) Scatter plot of the first two dominant signaling features, τ 2J and α 1J distinctively separating three c-Jun IEG phenotypes, shown through dotted lines. (L) The corresponding downstream transcription factor profiles shaped by c-Jun IEG phenotypes, displayed in H.
Fig 7
Fig 7. Kinetics of the peak retention of upstream signaling stratify late response of immediate early gene expression patterns in single cells.
(A) Scatter plot showing bivariate immediate early genes c-Fos and c-Jun expression levels in individual cells picked from same cell types (data from [20]). Expression levels (−ΔCt measured by realtime PCR) of 151 single cells are shown at 60 min after an induced hypertension stimulus (refer [20] for details of the experiment). Marginal histograms for 151 cells are shown at the top and right for c-Jun and c-Fos IEG, respectively. Four phenotypes were statistically determined from top 25 percentile and bottom 25 percentile of c-Fos and c-Jun expression distributions, respectively. Red corresponds to ‘high c-Fos and high c-Jun’ phenotype, cyan corresponds to ‘low c-Fos and high c-Jun’ phenotype, blue corresponds to ‘low c-Fos and low c-Jun’ phenotype, and orange ‘high c-Fos and low c-Jun’ phenotype. (B) Scatter plot of the feature-space for the first two dominant signaling features, τ 2J and τ 2E, distinctively separating four gene expression phenotypes, determined through similar statistics from model simulations. Note that the colors are same as that of the respective phenotypes defined in A. The first 250 cells in each phenotypic region were used in the analysis. The dotted lines in the plots are the classifiers estimated by the root, and the next significant branches of the decision tree in C. The gray region in the background corresponds to the variability in 100,000 cells, spanning the entire functional space of the signaling features. (C) Decision tree analysis to identify the key features and their conditionalities driving the downstream immediate early genes expression phenotypes as the categorizers of upstream features, for the cells in B. See Fig 5C for details.
Fig 8
Fig 8. Patterns in sensitivity and information-transfer maps correlate with topological organization of the network modules.
(A) Heatmap of sensitive signaling features to each intermediary response species at snapshot measures of early (20 min), intermediate (40 min), and late (58 min) phases of the stimulation. Orange colored boxes in the map represents sensitive features (S i > 0.1), and gray color represents non-sensitive features(S i ≤ 0.1). Unsupervised hierarchical clustering (of Pearson correlation distance matrix) was performed on the heatmap, shown as dendrograms on the left. Clustering unwinds coherent feedforward and positive feedback network motifs shown as blue and red colored species, respectively. (B) Heatmap of mutual information between each feature and intermediary response species for snapshot measures at early (20 min), intermediate (40 min) and late (58 min) phases of the stimulation. The scale bar reports the estimated mutual information in bits. Unsupervised hierarchical clustering (Pearson correlation distance matrix) was performed on the heatmap shown by dendrograms on the left. (C) Gene regulatory network showing network motifs of feedforward interactions (ERK/FRK module) and positive feedback loop (JNK module) as blue and red, respectively.

Similar articles

Cited by

References

    1. Rue P, Domedel-Puig N, Garcia-Ojalvo J, Pons AJ (2012) Integration of cellular signals in chattering environments. Progress in Biophysics and Molecular Biology 110: 106–112. 10.1016/j.pbiomolbio.2012.05.003 - DOI - PubMed
    1. Waltermann C, Klipp E (2011) Information theory based approaches to cellular signaling. Biochimica et Biophysica Acta (BBA)—General Subjects 1810: 924–932. 10.1016/j.bbagen.2011.07.009 - DOI - PubMed
    1. Davis DM, Purvis JE (2015) Computational analysis of signaling patterns in single cells. Seminars in Cell & Developmental Biology 37: 35–43. 10.1016/j.semcdb.2014.09.015 - DOI - PMC - PubMed
    1. Pauklin S, Vallier L (2013) The cell-cycle state of stem cells determines cell fate propensity. Cell 155: 135–147. 10.1016/j.cell.2013.08.031 - DOI - PMC - PubMed
    1. Bussemaker HJ, Li H, Siggia ED (2001) Regulatory element detection using correlation with expression. Nature Genetics 27: 167–171. 10.1038/84792 - DOI - PubMed

Publication types

MeSH terms

Substances

LinkOut - more resources