Review
. 2015 Oct 22;9(10):e0003985.
doi: 10.1371/journal.pntd.0003985. eCollection 2015.

Population Genetics and Reproductive Strategies of African Trypanosomes: Revisiting Available Published Data

Affiliations
Review

Population Genetics and Reproductive Strategies of African Trypanosomes: Revisiting Available Published Data

Mathurin Koffi et al. PLoS Negl Trop Dis. .

Abstract

Trypanosomatidae are a dangerous family of Euglenobionta parasites that threaten the health and economy of millions of people around the world. More precisely describing the population biology and reproductive mode of such pests is not only a matter of pure science, but can also be useful for understanding parasite adaptation, as well as how parasitism, specialization (parasite specificity), and complex life cycles evolve over time. Studying this parasite's reproductive strategies and population structure can also contribute key information to the understanding of the epidemiology of associated diseases; it can also provide clues for elaborating control programs and predicting the probability of success for control campaigns (such as vaccines and drug therapies), along with emergence or re-emergence risks. Population genetics tools, if appropriately used, can provide precise and useful information in these investigations. In this paper, we revisit recent data collected during population genetics surveys of different Trypanosoma species in sub-Saharan Africa. Reproductive modes and population structure depend not only on the taxon but also on the geographical location and data quality (absence or presence of DNA amplification failures). We conclude on issues regarding future directions of research, in particular vis-à-vis genotyping and sampling strategies, which are still relevant yet, too often, neglected issues.


Conflict of interest statement

The authors have declared that no competing interests exist.

Figures

Fig 1
Fig 1. Location of different samples of trypanosomes reanalyzed with population genetics tools for estimating population parameters.
1: Boffa and Dubréka (Guinea) HAT foci. Strains were isolated (I) [12] or directly amplified (D) [28]. 2: Bonon HAT focus (I) (Ivory Coast) [12]. 3: Campo, Bipindi, and Fontem HAT foci (Cameroon), (I) [23], (D) [36], 4: Mbini and Kogo HAT foci (Equatorial Guinea), (I) [23]. 5: Batangafo and Obo HAT foci (Central African Republic), (I) [23]. 6: Omougou HAT foci (Uganda), (I) [23]. 7: Nyanza HAT focus (Kenya), (I) [22,37]. 8: Luangwa HAT focus (Zambia), (I) [22,37]. 9: Busoga HAT focus (Uganda), (I) [22,37], (D) [38]. 10: Soroti HAT focus (Uganda), (D) [38]; 11. Maluku HAT foci (DRC), (D) [36]. 12: Nagana area of Central River District (The Gambia), (D) [5,7]. 13: Surra area of Darfour, Kurdofan, Kassala, Halfa and Showak (Sudan), (D) [39]. μ: Microsatellite genotyping; mini: minisatellite genotyping.
Fig 2
Fig 2. Regression between F IS, inbreeding index of individuals relative to subpopulations per locus, and Nei's unbiased estimator of genetic diversity H s [52] in Trypanosoma brucei gambiense 1 [19] in West Africa [12] and Central Africa [23].
The proportion of variance explained by the model (R 2) and the corresponding p-values are indicated.
Fig 3
Fig 3. Estimates of clonal population sizes, N Cl = -(1+F IS)/(4uF IS) for an isolated clonal population, of Trypanosoma brucei gambiense type 1 (Tbg1) and T. b. rhodesiense (Tbr) infecting humans with a mutation rate u = 10−3 for microsatellite markers (μ) and u = 0.03 for minisatellite markers (mini).
The name of the focus, the year of sampling, and the sample sizes are shown on the abscissa. Labels of sampling zones are the same as in Fig 1. For higher mutation rates (e.g., u = 0.0001 or 0.00001 for microsatellites), N Cl values must be multiplied by 10 and 100, respectively.
Fig 4
Fig 4. Results of the logistic regression between the proportions of heterozygous genotypes observed in Trypanosoma brucei gambiense from Guinea amplified from biological fluids and the number of amplification failures [28].
The relationship has been tested with the chi2 test, which proved highly significant (p-value < 0.001). 95% confidence intervals are presented with dotted lines.
Fig 5
Fig 5. No relationship (R 2 = 0) between F IS per locus and H s for T. vivax from The Gambia [5].
The only two loci that seem to behave as expected in a clonal population are connected with a dotted line. These two loci are therefore probably free of amplification problems.
Fig 6
Fig 6. Variation of F IS between loci and between subsamples (host species and year) for Trypanosoma congolense (“savannah” type) from The Gambia [7].
95% confidence intervals were obtained by jackknife on subsamples (three host species and two years), except for the average across all loci where the interval was obtained by bootstrapping over loci.
Fig 7
Fig 7. Neighbor-joining dendrogram based on a shared allele distance matrix [67] among pairs of individuals of Trypanosoma congolense ("savannah") from The Gambia [7].
The first letter represents the host species (C for cattle, H for horse, and D for donkey) and is followed by the year and finally by the individual numbers. The bracket indicates the most homogeneous group. The genotypes that are identical at all seven loci are shown in bold.
Fig 8
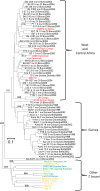
Fig 8. Neighbor-joining dendrogram based on a Cavalli-Sforza and Edwards [80] distance matrix of different samples of Trypanosoma brucei gambiense type 1 in Western and Central Africa and computed out of eight microsatellite loci [12].
Red, T. b. gambiense reference strains; gold, T. b. gambiense type 2; green, T. b. brucei; blue, T. b. rhodesiense. Isolates suspected of deriving from immigrants are in italics. Major (>50%) bootstrap values are also indicated. Bootstraps were undertaken with the isolate Stib215 as the root (T. b. brucei).

References

    1. Claes F, Buscher P, Touratier L, Goddeeris BM. Trypanosoma equiperdum: master of disguise or historical mistake? Trends Parasitol. 2005;21(7):316–21. - PubMed
    1. MacLeod A, Tweedie A, McLellan S, Taylor S, Cooper A, Sweeney L, et al. Allelic segregation and independent assortment in T. brucei crosses: Proof that the genetic system is Mendelian and involves meiosis. Mol Biochem Parasitol. 2005;143(1):12–9. - PubMed
    1. Tait A, MacLeod A, Tweedie A, Masiga D, Turner CMR. Genetic exchange in Trypanosoma brucei: Evidence for mating prior to metacyclic stage development. Mol Biochem Parasitol. 2007;151(1):133–6. - PMC - PubMed
    1. Tait A, Morrison LJ, Duffy CW, Cooper A, Turner CM, Macleod A. Trypanosome genetics: populations, phenotypes and diversity. Vet Parasitol. 2011;181:61–8. 10.1016/j.vetpar.2011.04.024 - DOI - PubMed
    1. Duffy CW, Morrison LJ, Black A, Pinchbeck GL, Christley RM, Schoenefeld A, et al. Trypanosoma vivax displays a clonal population structure. Int J Parasitol. 2009;39(13):1475–83. 10.1016/j.ijpara.2009.05.012 - DOI - PubMed

Publication types

LinkOut - more resources