. 2015 Oct 22;10(10):e0140852.
doi: 10.1371/journal.pone.0140852. eCollection 2015.

Functional Impairment of Myeloid Dendritic Cells during Advanced Stage of HIV-1 Infection: Role of Factors Regulating Cytokine Signaling

Affiliations

Functional Impairment of Myeloid Dendritic Cells during Advanced Stage of HIV-1 Infection: Role of Factors Regulating Cytokine Signaling

Meenakshi Sachdeva et al. PLoS One. .

Abstract

Introduction: Severely immunocompromised state during advanced stage of HIV-1 infection has been linked to functionally defective antigen presentation by dendritic cells (DCs). The molecular mechanisms behind DC impairment are still obscure. We investigated changes in DC function and association of key regulators of cytokine signaling during different stages of HIV-1 infection and following antiretroviral therapy (ART).

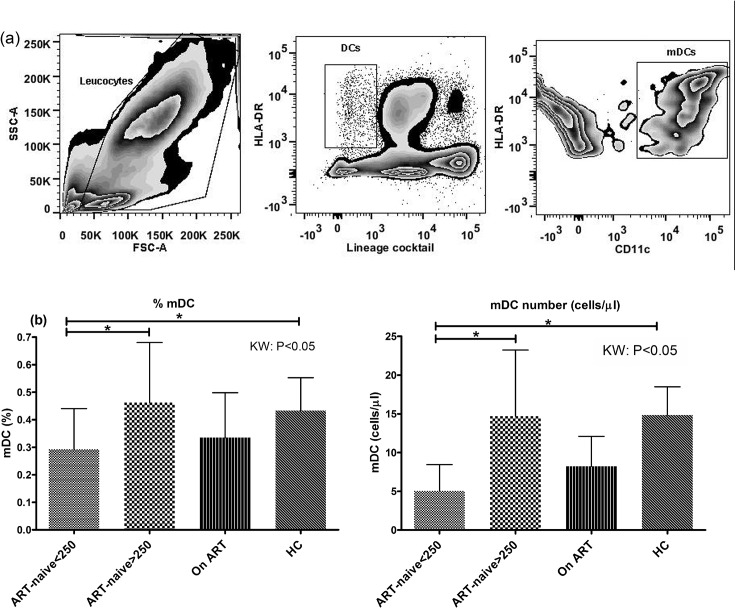
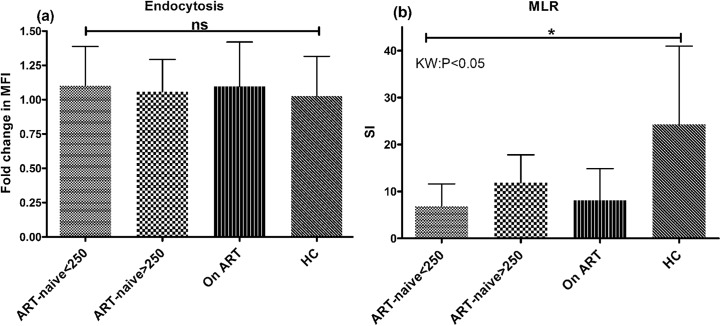
Methods: Phenotypic and functional characteristics of circulating myeloid DCs (mDCs) in 56 ART-naive patients (23 in early and 33 in advanced stage of disease), 36 on ART and 24 healthy controls were evaluated. Sixteen patients were studied longitudinally prior-to and 6 months after the start of ART. For functional studies, monocyte-derived DCs (Mo-DCs) were evaluated for endocytosis, allo-stimulation and cytokine secretion. The expression of suppressor of cytokine signaling (SOCS)-1 and other regulators of cytokine signaling was evaluated by real-time RT-PCR.

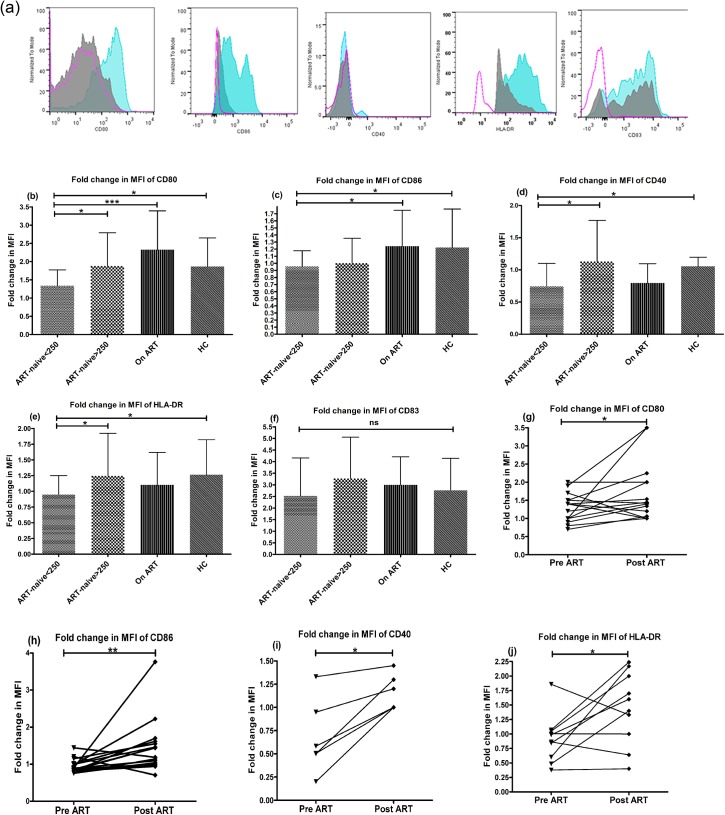
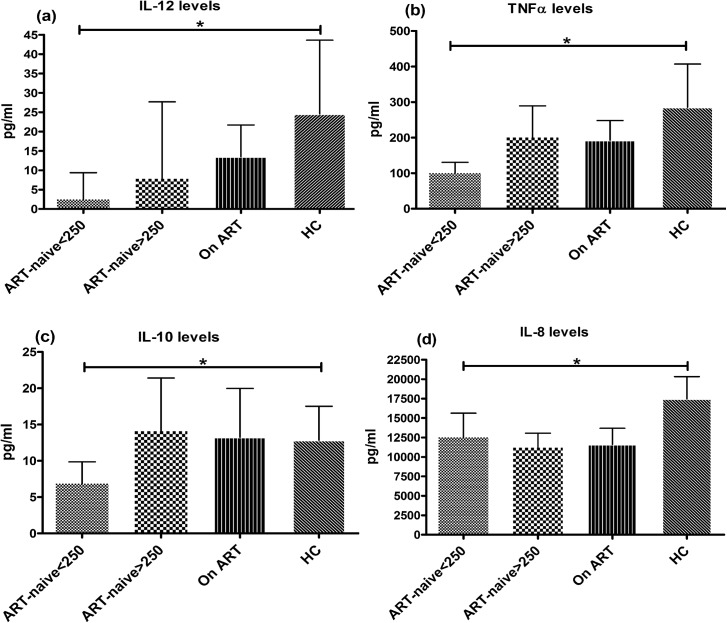
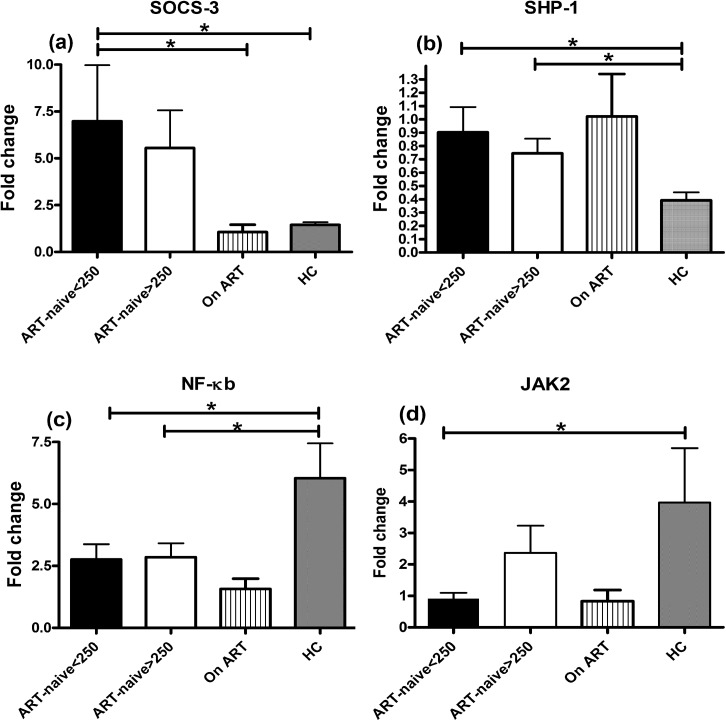
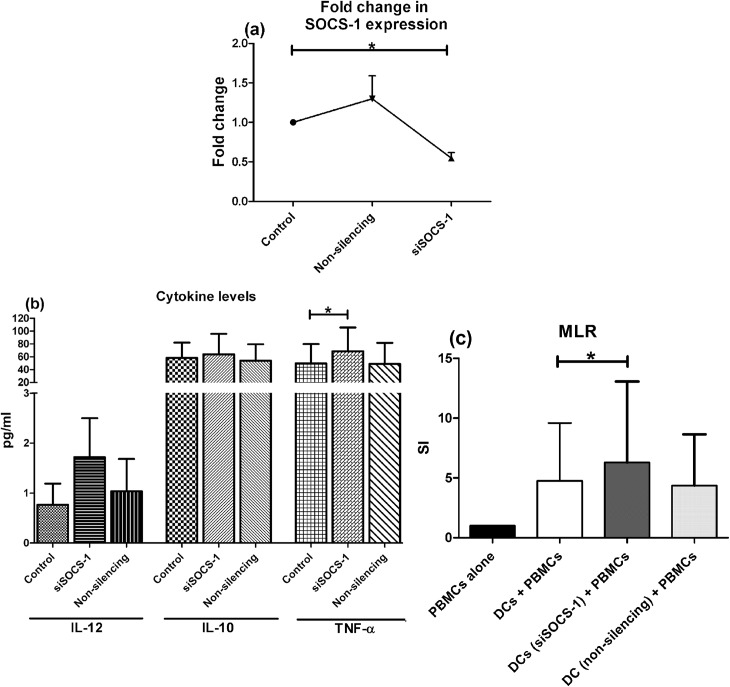
Results: The ability to respond to an antigenic stimulation was severely impaired in patients in advanced HIV-1 disease which showed partial recovery in the treated group. Mo-DCs from patients with advanced HIV-disease remained immature with low allo-stimulation and reduced cytokine secretion even after TLR-4 mediated stimulation ex-vivo. The cells had an increased expression of negative regulatory factors like SOCS-1, SOCS-3, SH2-containing phosphatase (SHP)-1 and a reduced expression of positive regulators like Janus kinase (JAK)2 and Nuclear factor kappa-light-chain-enhancer of activated B cells (NF-κB)1. A functional recovery after siRNA mediated silencing of SOCS-1 in these mo-DCs confirms the role of negative regulatory factors in functional impairment of these cells.

Conclusions: Functionally defective DCs in advanced stage of HIV-1 infection seems to be due to imbalanced state of negative and positive regulatory gene expression. Whether this is a cause or effect of increased viral replication at this stage of disease, needs further investigation. The information may be useful in design of novel therapeutic targets for better management of disease.


Conflict of interest statement

Competing Interests: The authors have declared that no competing interests exist.

Figures

Fig 1
Fig 1. HIV-1 infected patients (CD4+ T-cell counts<250) have lower frequency of mDCs.
(a) A representative picture showing strategy for gating mDCs in a healthy control subject wherein total leucocytes were gated for selection of DCs (Lineage-ve, HLA-DR+ve) for onward selection of myeloid DC cluster (CD11c+ve and HLA-DR+ve). (b) The percentage of mDCs were significantly lower in ART-naïve patients, CD4+ T-cell counts<250 cells/μL (n = 23) as compared to patients with CD4+ T-cell counts>250 cells/μL (n = 33) and HCs (n = 24) (p<0.05). (c) The absolute count of mDCs (cells/μL) was also sigificantly lower in ART-naïve patients, CD4+ T-cell counts<250 cells/μL as compared to patients with CD4+ T-cell counts>250 cells/μL and HCs (KW: p<0.05). Statistical analysis was performed using Kruskall-Wallis (KW) test for comparisons between multiple groups with pairwise comparisons using Dunn's multiple comparison adjustment for an overall p value<0.05. Data are represented as mean ± SD. *, P<0.05
Fig 2
Fig 2. Reduced responsiveness of mDCs of ART-naive patients (CD4+ T-cell counts<250 cells/μL) to LPS-stimulation.
The ability of circulating mDCs to respond to TLR stimulation was assessed using a whole blood DC assay by their abilities to upregulate costimulatory molecules CD80, CD86, CD40, maturation marker CD83 and HLA-DR in response to 5-hour stimulation with LPS (500ng/ml) by flowcytometry in 23 ART-naive patients in advanced stage of disease; 33 patients in early stage of disease, 36 patients on ART and 24 HCs. (a) A representative picture for all markers in a HC subject is shown. The open pink histogram shows the isotype control, solid grey histogram, the unstimulated control and solid blue histogram, the stimulated cells. The fold change in MFI, as a measure of change in expression level of each marker of stimulated mDCs was calculated over the unstimulated mDCs. The HIV-1 infected patients in advanced stage (CD4+ T-cell counts<250) had significantly lower upregulation of (b) CD80, (c) CD86, (d) CD40 and (e) HLA-DR as compared to HCs (p<0.05). (f) The expression of CD83 was not statistically different between the HIV-infected groups and the HCs. Statistical analysis was performed using Kruskall-Wallis (KW) test for comparisons between multiple groups with pairwise comparisons using Dunn's multiple comparison adjustment for an overall p values <0.05. Longitudinal analysis of 16 patients pre- and post- 6 months of ART was done by Wilcoxon matched-pairs signed rank test and revealed a significant increase in the expression of CD80, CD86, CD40 (n = 6) and HLA-DR (g to j) but not for CD83. Data are represented as mean ± SD. *, P<0.05; **, P<0.01; ***, P<0.001; ns, not significant.
Fig 3
Fig 3. Defective phenotype of mDCs for migration from periphery to lymphoid tissues.
(a) A representative flowcytogram of a healthy control subject showing CCR7 and CCR8 expression on mDCs. The open pink histograms shows the isotype control, solid grey histogram shows the unstimulated control and solid blue histogram shows the stimulated control. The ability of mDCs to upregulate chemokine receptors CCR7 (b) and CCR8 (c) in response to a 5-hour stimulation to LPS (500ng/ml) by flowcytometry in ART-naive patients with CD4+ T-cell counts<250 cells/μL (n = 9) and CD4+ T-cell counts>250 cells/μL (n = 5) and compared with patients on ART with CD4+ T-cell counts>350 cells/μL (n = 9). The patients in late stage of HIV had significantly lower ability to up-regulate CCR8 (p<0.05) as compared to HCs. Data are represented as mean±SD. **, P<0.01; ns not significant.
Fig 4
Fig 4. (a) Retained endocytosis ability of mo-DCs post LPS-stimulation. The fold change in the uptake of FITC-dextran as a measure of endocytosis was calculated in mo-DCs post-LPS stimulation (500ng/ml) for 2 days by flowcytometry in 23 ART-naive patients in advanced stage of disease; 33 patients in early stage, 36 patients on ART and 24 healthy controls.
The mo-DCs from patients in advanced stage depict immature phenotype of mo-DC post-LPS stimulation as indicated by retained endocytosis of antigen even after maturation stimulus as compared to HCs although no significant differences were observed among various study groups. (b) Allo-stimulation of healthy lymphocytes by mo-DCs of various patient groups. The ability of mo-DCs to induce lymphocyte proliferation was evaluated by CFSE dye dilution method in ART-naive patients in advanced stage of disease (n = 9) and early stage of disease (n = 5) and the stimulation index was compared with patients on ART with CD4+ T-cell counts>350 cells/μL (n = 9). Mo-DCs of patients in advanced stage of HIV disease had significantly lower SI as compared to HCs (p<0.05). Data are represented as mean ± SD. *, P<0.05.
Fig 5
Fig 5. Cytokine secretion from mo-DCs post LPS-stimulation.
Level of inflammatory cytokines (IL-12, TNFα, IL-10 and IL-8) was measured in the culture supernatants of mo-DCs after LPS-stimulation (500ng/ml) for 2 days by multiplex cytometric bead array (CBA) technique in 23 ART-naive patients in advanced stage of HIV disease; 33 patients in early stage, 36 patients on ART and 24 HCs and the results were expressed in pg/ml. The HIV infected patients in advanced stage of disease (CD4+ T-cell counts<250 cells/μL) had significantly lower secretion of (a) IL-12, (b) TNFα, (c) IL-10 and (d) IL-8 as compared to HCs (p<0.05). Patients with higher CD4+ T-cell counts had higher levels of IL-12, TNFα and IL-10, although statistically non-significant. Patients on ART did not depict significant increase in the levels of these cytokines. Data are represented as mean ± SD. *, P<0.05.
Fig 6
Fig 6. Increased expression of SOCS-1 in mo-DCs of ART-naive patients in advanced stage of HIV disease.
The expression levels of SOCS-1 mRNA was measured relative to the house keeping gene β-actin post LPS-stimulation (500ng/ml) for 48hrs in 23 ART-naive patients in advanced stage of HIV disease; 33 patients in early stage, 36 patients on ART and 24 HCs by Real time PCR using SYBR Green chemistry. (a) Fold change in the levels were calculated over the unstimulated controls. Statistical analysis was performed using Kruskall-Wallis (KW) test for comparisons between multiple groups with pairwise comparisons using Dunn's multiple comparison adjustment for an overall p values <0.05. Patients with lower CD4+ T-cell counts (<250 cells/μL) had significantly higher expression than HCs and the patients with higher CD4+ T-cell counts (>250 cells/μL) (p<0.05). The patients on ART also had significantly lower levels of SOCS-1 expression as compared to ART-naïve patients in advanced stage of disease (p<0.05). (b) The SOCS-1 levels had significant inverse relationship with CD4+ T-cell counts among the ART-naive subjects (p<0.05). Data are represented as mean ± SD. *, P<0.05; **, P<0.01.
Fig 7
Fig 7. Expression levels of SOCS-3, SHP-1, NF-κB1 and JAK2 in different study groups.
The fold change in the expression of SOCS-3, SHP-1, NF-κB and JAK2 was measured in ART-naive patients (n = 9) with CD4+ T-cell counts<250 cells/μL and patients with CD4+ T-cell counts>250 cells/μL (n = 9) along with HCs (n = 9) and patients on ART (n = 9). Kruskall-Wallis (KW) test was performed for comparisons between multiple groups with pairwise comparisons using Dunn's multiple comparison adjustment for an overall p values <0.05. (a) The expression of SOCS-3 was significantly higher in patients with CD4+ T-cell counts<250 cells/μL as compared to HCs and patients on ART (p<0.05). (b) The expression of SHP-1 mRNA levels were also significantly higher in patients in advanced HIV-disease as compared to HCs (p<0.05). (c) The expression of NF-κB1 and (d) JAK2 on the other hand was significantly lower (p<0.05) in this patient group compared to HCs. Data are represented as mean ± SD. *, P<0.05.
Fig 8
Fig 8. SOCS-1 silencing enhances cytokine production and stimulatory capacity of mo-DCs.
Mo-DCs from 6 ART-naive patients in the advanced stage of HIV-1 infection were transfected with 5nmol siRNA to SOCS-1 gene for 48 hours. Cells treated with a scrambled non-silencing RNA or untreated cells served as control. Friedmann test was performed for comparisons between treated groups with pairwise comparisons using Dunn's multiple comparison adjustment for an overall p values <0.05. (a) Mo-DCs treated with siSOCS-1 had around 50% decrease in the expression of SOCS-1 gene which was significantly less than the control cells (p<0.05). (b) Culture supernatants were evaluated for the levels of inflammatory cytokines by CBA. The levels of IL-12, IL-10 and TNF-α were higher in SOCS-1 silenced mo-DCs which could reach statistically significant levels for TNF-α (p<0.05). (c).The allostimulatory capacity of SOCS-1 silenced mo-DCs was tested in co-cultures with PBMCs of a healthy individual by CFSE dye dilution assay. The SOCS-1 silenced mo-DCs induced a significantly higher allostimulation as compared to cells that had normal expression of SOCS-1. Data are represented as mean ± SD. *, P<0.05.

Similar articles

Cited by

References

    1. Levy JA, Scott I, Mackewicz C. Protection from HIV/AIDS: the importance of innate immunity. Clin Immunol. 2003; 108: 167–174. - PubMed
    1. Banchereau J, Steinman RM. Dendritic cells and the control of immunity. Nature. 1998; 392: 245–252. - PubMed
    1. Piguet V, Steinman RM. The interaction of HIV with dendritic cells: outcomes and pathways. Trends Immunol. 2007; 28: 503–510. - PMC - PubMed
    1. Rowland-Jones SL. Timeline: AIDS pathogenesis: what have two decades of HIV research taught us? Nat Rev Immunol. 2003; 3: 343–348. - PubMed
    1. Wijewardana V, Soloff AC, Liu X, Brown KN, Barratt-Boyes SM. Early myeloid dendritic cell dysregulation is predictive of disease progression in simian immunodeficiency virus infection. PLoS Pathog. 2010; 6: e1001235 10.1371/journal.ppat.1001235 - DOI - PMC - PubMed

Substances