. 2015 Oct 22;11(10):e1005588.
doi: 10.1371/journal.pgen.1005588. eCollection 2015 Oct.

Modulation of Ambient Temperature-Dependent Flowering in Arabidopsis thaliana by Natural Variation of FLOWERING LOCUS M

Affiliations

Modulation of Ambient Temperature-Dependent Flowering in Arabidopsis thaliana by Natural Variation of FLOWERING LOCUS M

Ulrich Lutz et al. PLoS Genet. .

Abstract

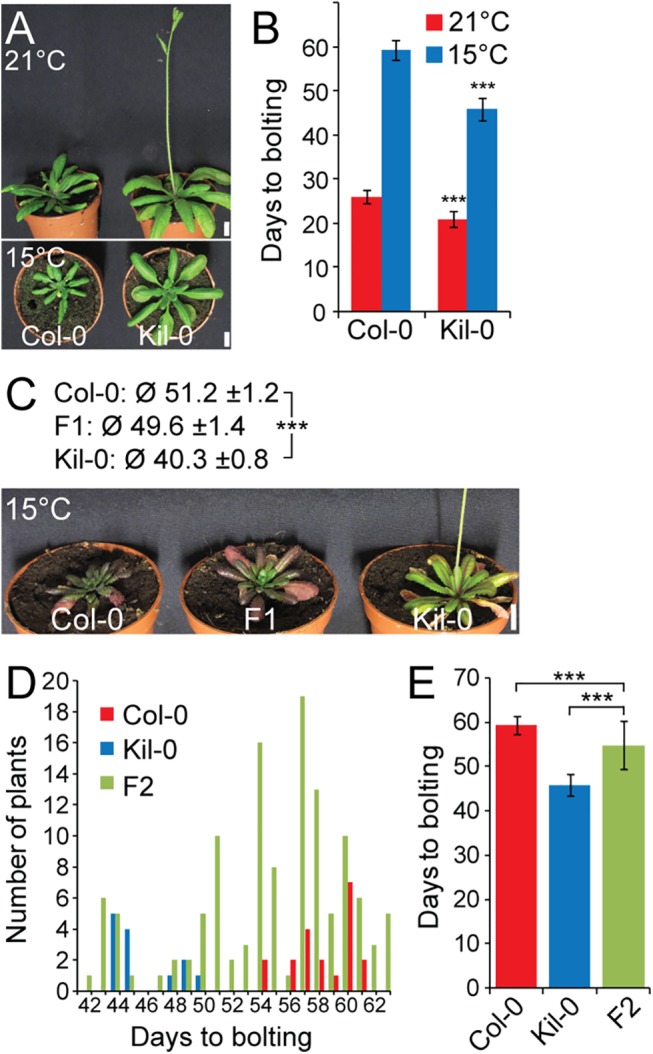
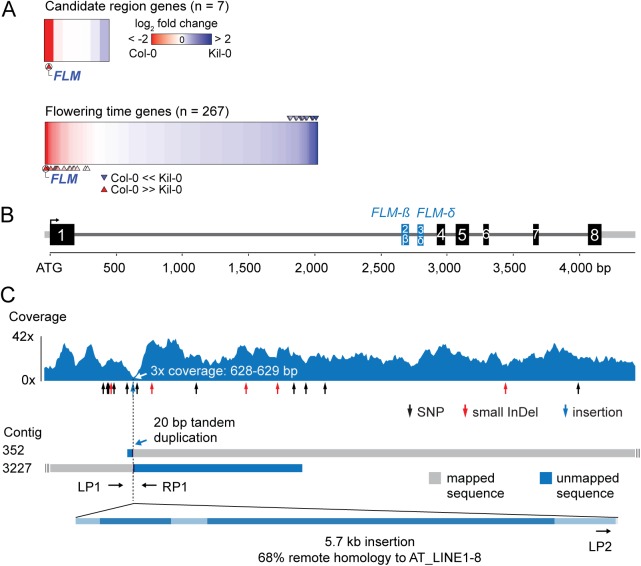
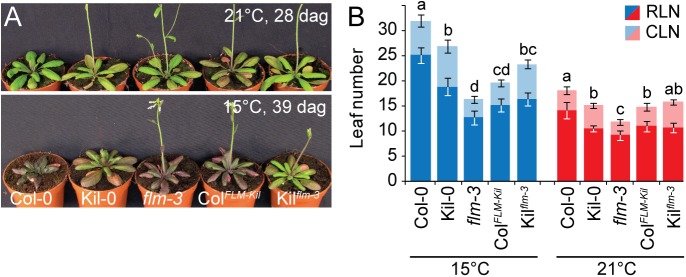
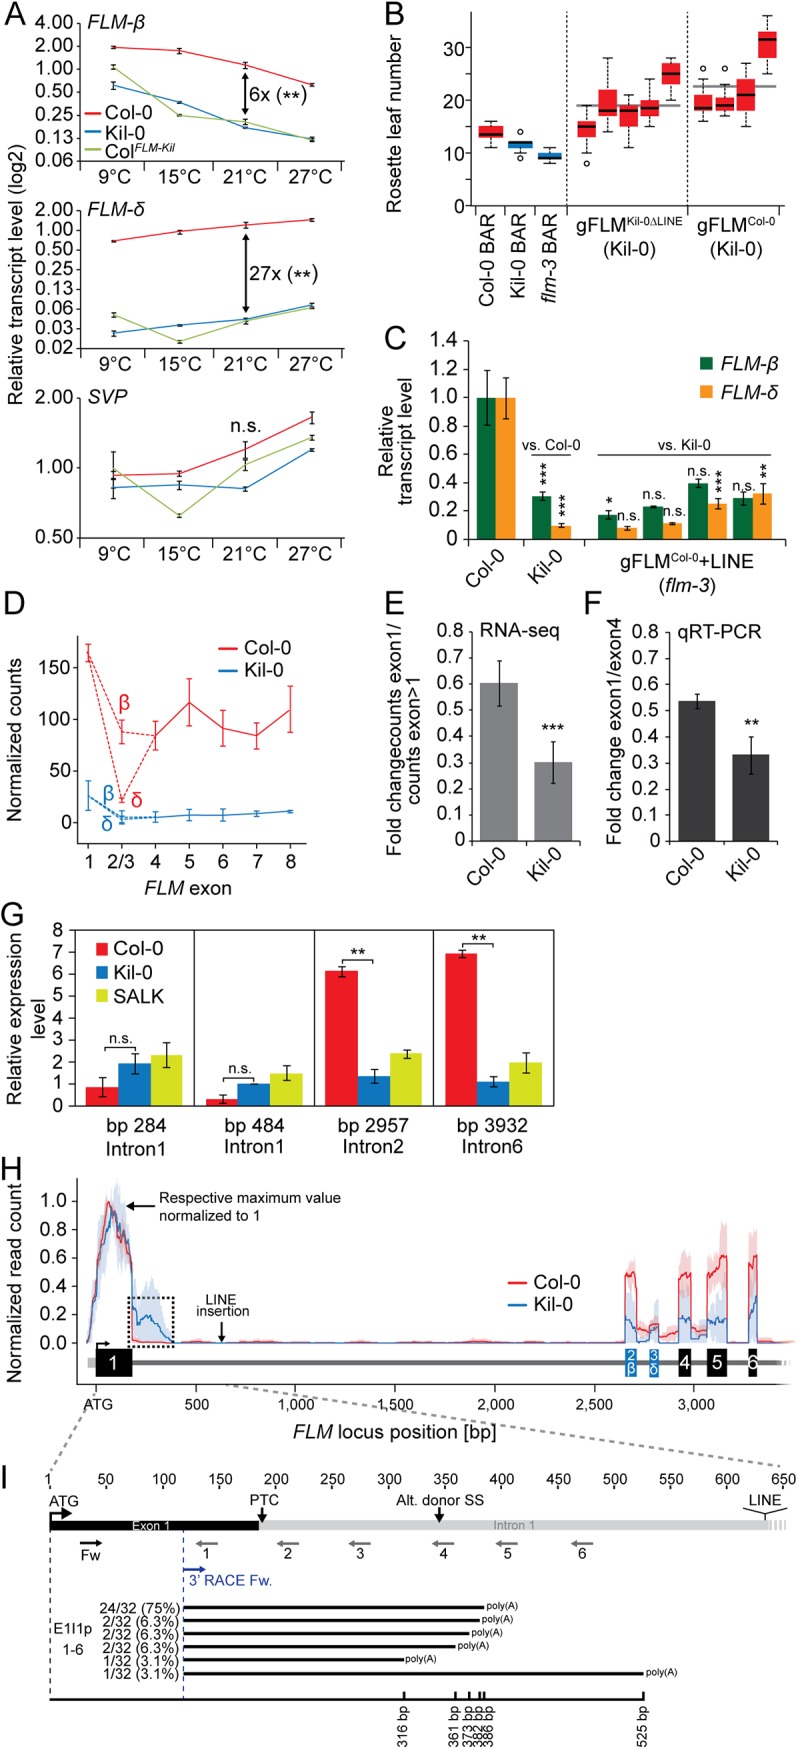
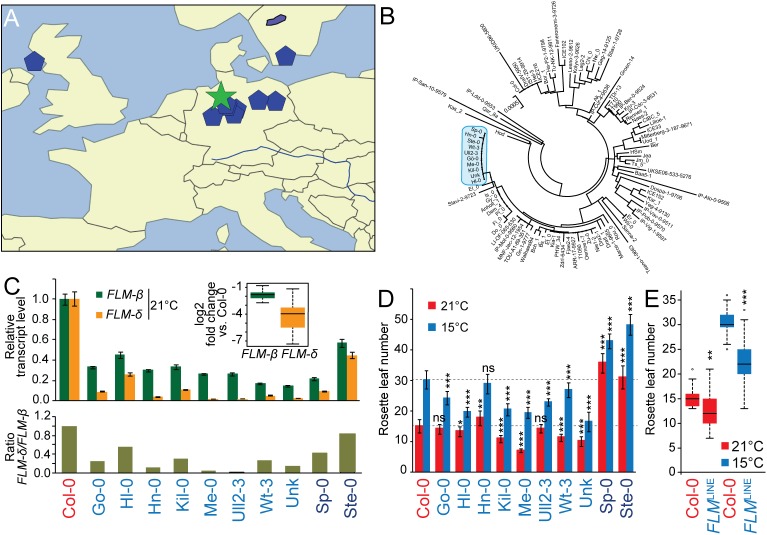
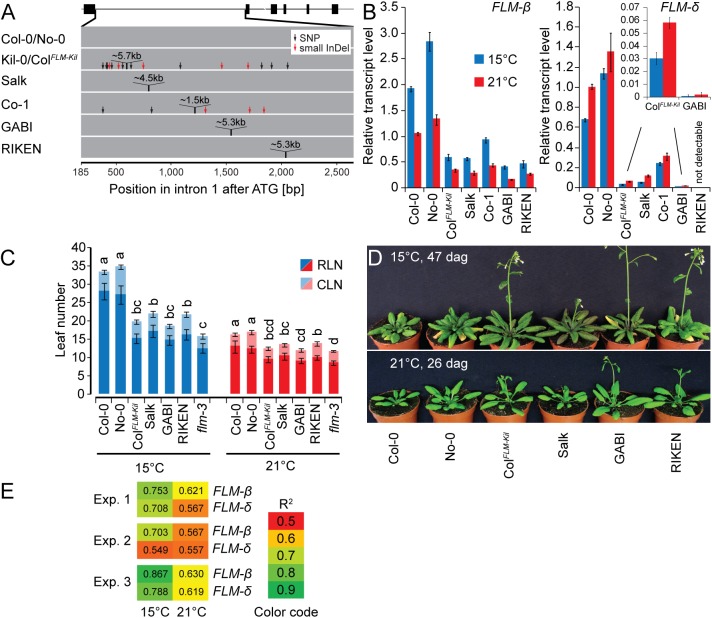
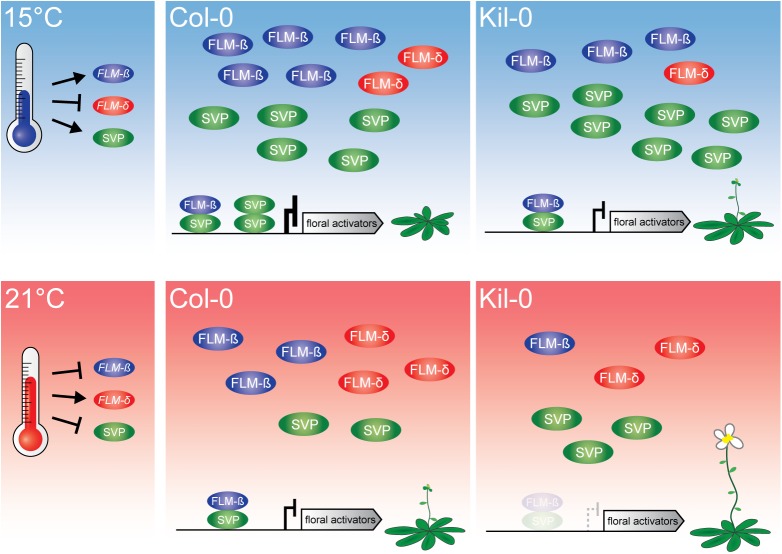
Plants integrate seasonal cues such as temperature and day length to optimally adjust their flowering time to the environment. Compared to the control of flowering before and after winter by the vernalization and day length pathways, mechanisms that delay or promote flowering during a transient cool or warm period, especially during spring, are less well understood. Due to global warming, understanding this ambient temperature pathway has gained increasing importance. In Arabidopsis thaliana, FLOWERING LOCUS M (FLM) is a critical flowering regulator of the ambient temperature pathway. FLM is alternatively spliced in a temperature-dependent manner and the two predominant splice variants, FLM-ß and FLM-δ, can repress and activate flowering in the genetic background of the A. thaliana reference accession Columbia-0. The relevance of this regulatory mechanism for the environmental adaptation across the entire range of the species is, however, unknown. Here, we identify insertion polymorphisms in the first intron of FLM as causative for accelerated flowering in many natural A. thaliana accessions, especially in cool (15°C) temperatures. We present evidence for a potential adaptive role of this structural variation and link it specifically to changes in the abundance of FLM-ß. Our results may allow predicting flowering in response to ambient temperatures in the Brassicaceae.


Conflict of interest statement

The authors have declared that no competing interests exist.

Figures

Fig 1
Fig 1. Early flowering is controlled by one major recessive locus in Kil-0.
(A) Representative photographs and (B) quantitative flowering time analysis (days to bolting ± SD) of Col-0 and Kil-0 grown under continuous light at 21°C and 15°C. (C) Representative photographs of 50 day-old plants of Col-0, Kil-0, and their F1 hybrid grown under continuous light at 15°C. The average days to bolting ± SD are indicated above the photograph. (D) Distribution of flowering time and (E) average days to bolting ± SD in a population of 124 F2 segregants from a Col-0 x Kil-0 hybrid as well as among Col-0 (n = 20) and Kil-0 (n = 15) plants. Student’s t-tests were performed in comparison to the wild type unless indicated otherwise in the figure: *** = p ≤ 0.001. Scale bar = 1 cm.
Fig 2
Fig 2. Identification of the Kil-0 early flowering locus.
(A) Heatmap of differentially expressed genes in Kil-0 versus Col-0 in 21°C as analyzed by RNA-seq. The upper panel shows the fold change expression between Kil-0 and Col-0 of the seven expressed genes in the 31.3 kb mapping interval depicted in S2E Fig. The lower panel shows expression values of 267 flowering time genes. Fold changes are log2 transformed, blue represents upregulation and red downregulation in Kil-0 compared to Col-0. Significantly differentially (p < 0.01) expressed genes are marked with arrows. (B) Gene model of the FLM Kil-0 locus of the Col-0 reference gene with the alternatively used exons 2 and 3 that give rise to FLM-ß and FLM-δ are shown in blue. Black boxes indicate exons, grey lines are 5’- or 3’-untranslated regions or introns. (C) Read coverage of the Kil-0 genomic data on the Col-0 reference gene model. Small sequence polymorphisms are indicated below the graph. Distribution of two independently assembled contigs from Kil-0 genomic sequence reads reveal the presence of a 5.7 kb insertion in FLM intron 1 with homology to the A. thaliana transposon At_LINE1-8. Sequence elements with homology to the LINE element are shown in dark blue in the lowermost panel. The respective positions of the primers used for the screening of further A. thaliana accessions are depicted.
Fig 3
Fig 3. FLM Kil-0 accelerates flowering.
(A) Photographs of representative 28 and 39 day-old plants of the ColFLM-Kil and Kilflm-3 backcross population in comparison to Col-0, Kil-0, and flm-3 grown at 15°C and 21°C in long day photoperiod. (B) Averages ± SD of the quantitative flowering time analysis (RLN, CLN; rosette and cauline leaf number) of the genotypes shown in (A). Similar letters indicate no significant difference of total leaf number (Tukey HSD, p < 0.05).
Fig 4
Fig 4. The large insertion in the first intron affects splicing efficiency and gene expression of FLM.
(A) qRT-PCR analysis of FLM-ß, FLM-δ, and SVP expression in ten day-old Col-0, Kil-0, and ColFLM-Kil plants. Seven day-old seedlings grown at 21°C were transferred to the indicated temperature and grown for further three days. The fold change differences between Col-0 and Kil-0 at 21°C are indicated in the graph. Error bars represent SE of three biological replicates. (B) Quantitative flowering time analysis of four—five independent T2 lines in the Kil-0 background that are either hemi- or homozygous for the respective transgene construct. 14–20 transgenic plants grown at 21°C under long day photoperiod were analyzed for each genotype. Transgenic T2 lines expressing the empty pGREEN0229 vector control construct (BAR+) in the Col-0, Kil-0, and flm-3 lines were analyzed for comparison. Outliers were determined based on 1.5 x IQR (interquartile range). (C) qRT-PCR analysis of FLM-ß and FLM-δ expression of four independent homozygous T3 lines of the indicated construct in the flm-3 background. Plants were grown for ten days under 21°C long day photoperiod. Error bars represent SE of three biological replicates. (D) Graph displaying normalized read counts for the seven FLM exons in Col-0 and Kil-0, including the differentially spliced exon 2 that gives rise to the FLM-ß and FLM-δ isoforms. (E) Quantification of the normalized read counts shown in (D). The average ratios and SD from three biological replicates of the read counts of exon 1 compared to the read counts of exon 2 to exon 7 are shown. (F) qRT-PCR-based verification of the RNA-seq result shown in (E) using fragments corresponding to FLM exon 1 and exon 4. The ratios ± SE of the respective expression values are shown from three biological replicates. (G) qRT-PCR quantification of unspliced pre-mRNA from isolated nuclei. Primers are located in FLM introns 1, 2, and 6 and ACT8 introns 2 and 3, respectively. Primer sequences are provided in S7 Table. The position of the respective reverse primer relative to the ATG start codon is indicated. Fold changes are averages ± SE of two biological replicates are indicated. Student’s t-tests: ** = p ≤ 0.01; n.s., not significant. (H) Normalized read counts for FLM as detected by RNA-seq in Col-0 and Kil-0 mapped to the genomic FLM locus from exon 1 through exon 5. For both accessions, the number of mapped RNA-seq reads was normalized to range from 0 (no expression) to 1 (maximum expression). Lines indicate the mean expression level and light blue and light red areas indicate the 5% and 95% confidence intervals that were determined across the biological replicates of one genotype. Exons are represented as boxes, untranslated regions and introns as lines. Note the relative increase in intron 1 reads in Kil-0 as indicated with a dotted line. The position of the LINE insertion in FLM Kil-0 is indicated by an arrow. Student’s t-tests were performed as indicated: * = p ≤ 0.05; ** ≤ 0.01; *** = p ≤ 0.001; n.s., not significant. (I) Schematic representation of the primers used for the qRT-PCR quantification of FLM intron 1 sequence-containing transcripts and the 3’-RACE PCR as indicated by arrows below the gene model; PTC, premature termination codon. A schematic representation of the intron 1 sequence-containing polyadenylated transcripts is indicated in the lower part of the panel. Numbers on the left indicate the frequency of each transcript among the 32 individual sequenced clones. The black line indicates the length of each transcript respective to the ATG start codon.
Fig 5
Fig 5. Geographical distribution and molecular analysis of FLM LINE accessions.
(A) Geographical distribution of the FLM LINE accessions (blue pentagons) with the centroid (green star). Please note that one the accession with an ambiguous name was excluded due to the unavailability of geographic information. (B) Neighbour-Joining tree showing the genetic relationship among FLM sequences. The FLM sequences of the 10 FLM LINE accessions were analyzed together with Col-0 and further 88 randomly selected sequences. The clade harboring all FLM LINE alleles is marked in blue; see S8 Fig for a detailed representation of the entire tree. (C) qRT-PCR analyses of FLM-ß and FLM-δ transcript abundance of ten day-old seedlings of all FLM LINE accessions when grown in 21°C long day photoperiod (upper panel). Averages ± SE of three measurements after normalization to Col-0 as a control are shown. The inserted graph shows the summarized log2-transformed fold changes of FLM LINE accessions only (Col-0 excluded). The lower panel displays the ratios of FLM-δ over FLM-ß when normalized to Col-0. (D) Quantitative flowering time analysis of FLM LINE accessions grown at 21°C and 15°C under long day photoperiod. Dashed lines mark the respective values for Col-0. Please note that Sp-0 and Ste-0 are vernalization-sensitive accessions. (E) The right graph shows the summarized rosette leaf number of the eight vernalization-insensitive FLM LINE accessions. Student’s t-tests were performed in comparison to Col-0 unless indicated otherwise: * = p ≤ 0.05; ** ≤ 0.01; *** = p ≤ 0.001; n.s., not significant. El-0 was identified relatively late in this study and not included in this detailed analysis.
Fig 6
Fig 6. The first intron carries important regions for isoform-specific FLM abundance.
(A) Schematic representation of the insertion lines used in this study. The FLM-ß gene model is depicted as shown in Fig 3C, intron 1 of the respective lines is depicted as a grey bar. (B) FLM-ß and FLM-δ expression of the lines shown in (A). Seven day-old seedlings were grown at 21°C and then transferred to 21°C or 15°C for further three days. Shown are averages and SE of three biological replicates. (C) Quantitative flowering time analysis of the lines shown in (A) with Col-0 and No-0 as wild type controls. Similar letters indicate no significant difference of total leaf number (Tukey HSD, p < 0.05). (D) Representative photographs of the lines shown in (A) at 26 and 47 days after germination (dag) when grown at 21°C and 15°C temperature and under long day photoperiod. (E) Correlation analysis of the flowering time experiment shown in Fig 6C and further two independent experiments (15°C and 21°C) with the expression values shown in Fig 6B. Note that flowering time values of the loss-of-function allele flm-3 were also included in this analysis but that its FLM expression was set to 0 (no expression). R2 values from linear regression are shown.
Fig 7
Fig 7. Model of the proposed mode of FLM action.
At 15°C, flowering is delayed due to an active repression of floral activators by FLM-ß-SVP heterodimers. An increased ambient temperature (21°C) results in decreased levels of the transcriptional repressive FLM-ß-SVP protein complexes and floral activator genes are expressed. Flowering in Kil-0 (right) might be accelerated in comparison to Col-0 due to a decreased abundance of FLM-ß at 15°C as well as at 21°C while SVP is unaltered in the different temperatures and between Kil-0 and Col-0. Note that our study suggests a minor role of FLM-δ in the control of flowering time in the lines and conditions examined. The present model assumes that protein abundance follows transcript abundance except for SVP, which is degraded in response to increasing temperature [20].

Comment in

Similar articles

Cited by

References

    1. Andres F, Coupland G. The genetic basis of flowering responses to seasonal cues. Nat Rev Genet. 2012;13(9):627–39. Epub 2012/08/18. 10.1038/nrg3291 - DOI - PubMed
    1. Song J, Irwin J, Dean C. Remembering the prolonged cold of winter. Curr Biol. 2013;23(17):R807–11. Epub 2013/09/14. 10.1016/j.cub.2013.07.027 - DOI - PubMed
    1. Kumar SV, Wigge PA. H2A.Z-containing nucleosomes mediate the thermosensory response in Arabidopsis. Cell. 2010;140(1):136–47. Epub 2010/01/19. 10.1016/j.cell.2009.11.006 - DOI - PubMed
    1. Balasubramanian S, Weigel D. Temperature Induced Flowering in Arabidopsis thaliana. Plant Signal Behav. 2006;1(5):227–8. Epub 2006/09/01. - PMC - PubMed
    1. Wigge PA. Ambient temperature signalling in plants. Curr Opin Plant Biol. 2013;16(5):661–6. Epub 2013/09/12. 10.1016/j.pbi.2013.08.004 - DOI - PubMed

Publication types

MeSH terms