

Quantitative DNA Analyses for Airborne Birch Pollen
- PMID: 26492534
- PMCID: PMC4619600
- DOI: 10.1371/journal.pone.0140949
Quantitative DNA Analyses for Airborne Birch Pollen
Abstract
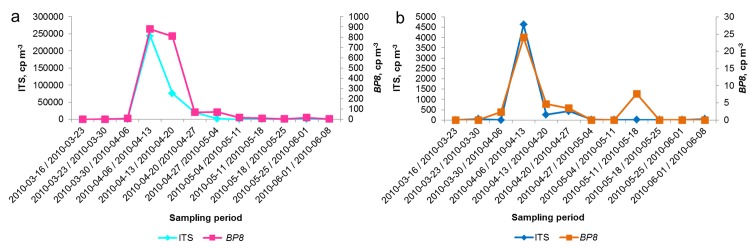
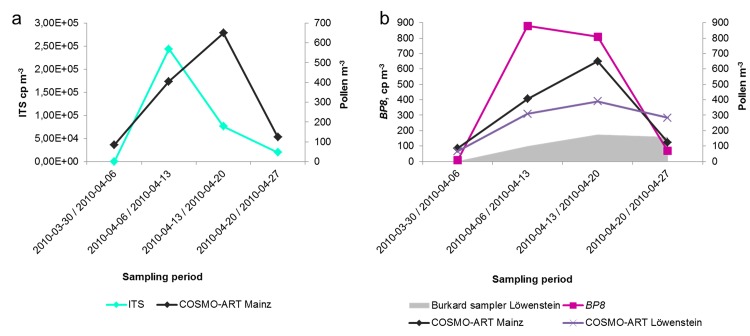
Birch trees produce large amounts of highly allergenic pollen grains that are distributed by wind and impact human health by causing seasonal hay fever, pollen-related asthma, and other allergic diseases. Traditionally, pollen forecasts are based on conventional microscopic counting techniques that are labor-intensive and limited in the reliable identification of species. Molecular biological techniques provide an alternative approach that is less labor-intensive and enables identification of any species by its genetic fingerprint. A particularly promising method is quantitative Real-Time polymerase chain reaction (qPCR), which can be used to determine the number of DNA copies and thus pollen grains in air filter samples. During the birch pollination season in 2010 in Mainz, Germany, we collected air filter samples of fine (<3 μm) and coarse air particulate matter. These were analyzed by qPCR using two different primer pairs: one for a single-copy gene (BP8) and the other for a multi-copy gene (ITS). The BP8 gene was better suitable for reliable qPCR results, and the qPCR results obtained for coarse particulate matter were well correlated with the birch pollen forecasting results of the regional air quality model COSMO-ART. As expected due to the size of birch pollen grains (~23 μm), the concentration of DNA in fine particulate matter was lower than in the coarse particle fraction. For the ITS region the factor was 64, while for the single-copy gene BP8 only 51. The possible presence of so-called sub-pollen particles in the fine particle fraction is, however, interesting even in low concentrations. These particles are known to be highly allergenic, reach deep into airways and cause often severe health problems. In conclusion, the results of this exploratory study open up the possibility of predicting and quantifying the pollen concentration in the atmosphere more precisely in the future.
Conflict of interest statement
Figures
Similar articles
-
Quantification of airborne birch (Betula sp.) pollen grains and allergens in Krakow.Arch Immunol Ther Exp (Warsz). 2005 Mar-Apr;53(2):169-74. Arch Immunol Ther Exp (Warsz). 2005. PMID: 15928586
-
The long-range transport of birch (Betula) pollen from Poland and Germany causes significant pre-season concentrations in Denmark.Clin Exp Allergy. 2007 Aug;37(8):1204-12. doi: 10.1111/j.1365-2222.2007.02771.x. Clin Exp Allergy. 2007. PMID: 17651151
-
Birch pollen rupture and the release of aerosols of respirable allergens.Clin Exp Allergy. 2004 Oct;34(10):1591-6. doi: 10.1111/j.1365-2222.2004.02078.x. Clin Exp Allergy. 2004. PMID: 15479275
-
[Perspectives on synergic biological effects induced by ambient allergenic pollen and urban fine/ultrafine particulate matters in atmosphere].Huan Jing Ke Xue. 2010 Sep;31(9):2260-6. Huan Jing Ke Xue. 2010. PMID: 21072956 Review. Chinese.
-
[Allergenic pollens in Spain].Allergol Immunopathol (Madr). 2004 May-Jun;32(3):121-4. doi: 10.1016/s0301-0546(04)79297-6. Allergol Immunopathol (Madr). 2004. PMID: 15120027 Review. Spanish.
Cited by
-
Molecular analysis confirms the long-distance transport of Juniperus ashei pollen.PLoS One. 2017 Mar 8;12(3):e0173465. doi: 10.1371/journal.pone.0173465. eCollection 2017. PLoS One. 2017. PMID: 28273170 Free PMC article.
-
Air Pollution and Climate Change Effects on Allergies in the Anthropocene: Abundance, Interaction, and Modification of Allergens and Adjuvants.Environ Sci Technol. 2017 Apr 18;51(8):4119-4141. doi: 10.1021/acs.est.6b04908. Epub 2017 Apr 6. Environ Sci Technol. 2017. PMID: 28326768 Free PMC article.
-
Species Richness, rRNA Gene Abundance, and Seasonal Dynamics of Airborne Plant-Pathogenic Oomycetes.Front Microbiol. 2018 Nov 15;9:2673. doi: 10.3389/fmicb.2018.02673. eCollection 2018. Front Microbiol. 2018. PMID: 30498479 Free PMC article.
-
Allergenic Asteraceae in air particulate matter: quantitative DNA analysis of mugwort and ragweed.Aerobiologia (Bologna). 2017;33(4):493-506. doi: 10.1007/s10453-017-9485-3. Epub 2017 Jun 6. Aerobiologia (Bologna). 2017. PMID: 29167600 Free PMC article.
References
-
- Cecchi L. Introduction In: Sofiev M, Bergmann K-C, editors. Allergenic pollen A Review of the Production, Release, Distribution and Health impacts. Dordrecht, Heidelberg, New York, London, Heidelberg, New York, London: Springer; 2013. pp. 1–7.
-
- D’Amato G, Cecchi L, Bonini S, Nunes C, Annesi-Maesano I, Behrendt H, et al. Allergenic pollen and pollen allergy in Europe. Allergy. 2007;62: 976–990. - PubMed
-
- Mücke W, Lemmen C. Bioaerosole und Gesundheit Mücke W. and Lemmen C. Ecomed Medizin. Verlagsgruppe Hüthig, Jehle, Rehm GmbH; 2008.
-
- Hirst JM. An automatic volumetric spore trap. Ann Appl Biol. 1952;39: 257–265.
MeSH terms
Substances
LinkOut - more resources
Full Text Sources
Other Literature Sources
Research Materials
