

A Multicenter Longitudinal Study of Hospital-Onset Bacteremia: Time for a New Quality Outcome Measure?
- PMID: 26493213
- PMCID: PMC4731295
- DOI: 10.1017/ice.2015.261
A Multicenter Longitudinal Study of Hospital-Onset Bacteremia: Time for a New Quality Outcome Measure?
Erratum in
-
A Multicenter Longitudinal Study of Hospital-Onset Bacteremia: Time for a New Quality Outcome Measure? - ERRATUM.Infect Control Hosp Epidemiol. 2016 Feb;37(2):243. doi: 10.1017/ice.2015.314. Epub 2015 Dec 11. Infect Control Hosp Epidemiol. 2016. PMID: 26651520 No abstract available.
Abstract
Background: Central-line-associated bloodstream infection (CLABSI) rate is an important quality measure, but it suffers from subjectivity and interrater variability, and decreasing national CLABSI rates may compromise its power to discriminate between hospitals. This study evaluates hospital-onset bacteremia (HOB, ie, any positive blood culture obtained 48 hours post admission) as a healthcare-associated infection-related outcome measure by assessing the association between HOB and CLABSI rates and comparing the power of each to discriminate quality among intensive care units (ICUs).
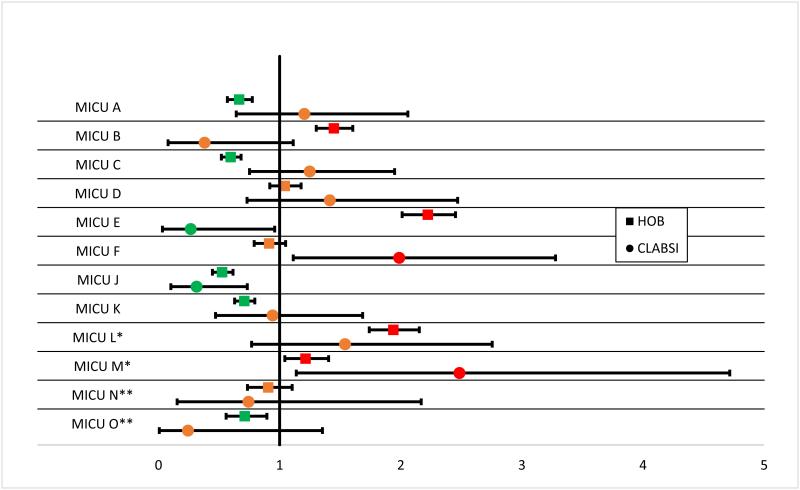
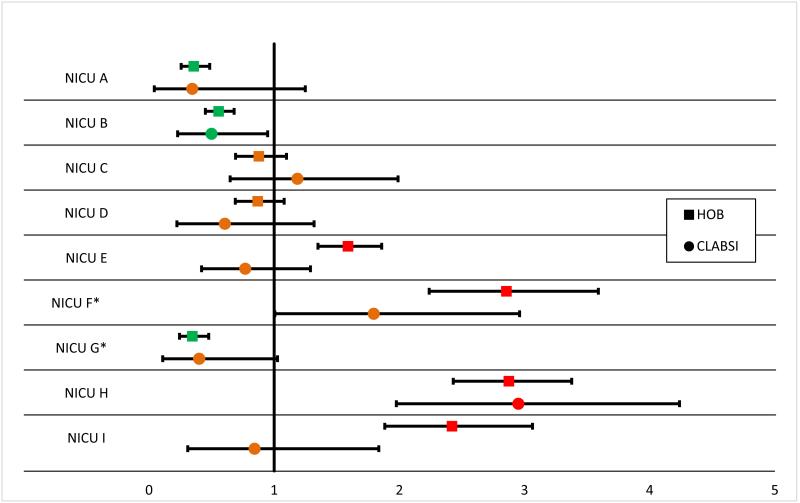
Methods: In this multicenter study, ICUs provided monthly CLABSI and HOB rates for 2012 and 2013. A Poisson regression model was used to assess the association between these 2 rates. We compared the power of each measure to discriminate between ICUs using standardized infection ratios (SIRs) with 95% confidence intervals (CIs). A measure was defined as having greater power to discriminate if more of the SIRs (with surrounding CIs) were different from 1.
Results: In 80 ICUs from 16 hospitals in the United States and Canada, a total of 663 CLABSIs, 475,420 central line days, 11,280 HOBs, and 966,757 patient days were reported. An absolute change in HOB of 1 per 1,000 patient days was associated with a 2.5% change in CLABSI rate (P<.001). Among the 80 ICUs, 20 (25%) had a CLABSI SIR and 60 (75%) had an HOB SIR that was different from 1 (P<.001).
Conclusion: Change in HOB rate is strongly associated with change in CLABSI rate and has greater power to discriminate between ICU performances. Consideration should be given to using HOB to replace CLABSI as an outcome measure in infection prevention quality assessments.
Figures
References
-
- Rajaram R, Barnard C, Bilimoria KY. Concerns About Using the Patient Safety Indicator-90 Composite in Pay-for-Performance Programs. JAMA. 2015;313:897–8. - PubMed
-
- [July 2, 2015];Medicare Hospital Compare Quality of Care [Internet] http://www.medicare.gov/hospitalcompare/search.html.
-
- Sexton DJ, Chen LF, Moehring R, Thacker PA, Anderson DJ. Casablanca redux: we are shocked that public reporting of rates of central line-associated bloodstream infections are inaccurate. Infect Control Hosp Epidemiol. 2012;33:932–5. - PubMed
Publication types
MeSH terms
Grants and funding
LinkOut - more resources
Full Text Sources
Other Literature Sources
