. 2015 Dec;84(5):989-1004.
doi: 10.1111/tpj.13062.

The RNA helicase, eIF4A-1, is required for ovule development and cell size homeostasis in Arabidopsis

Affiliations

The RNA helicase, eIF4A-1, is required for ovule development and cell size homeostasis in Arabidopsis

Maxwell S Bush et al. Plant J. 2015 Dec.

Abstract

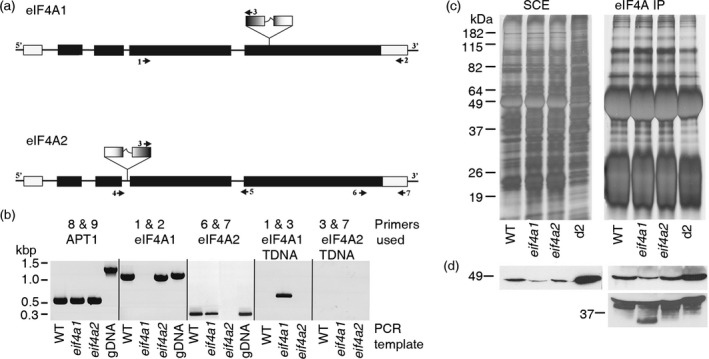
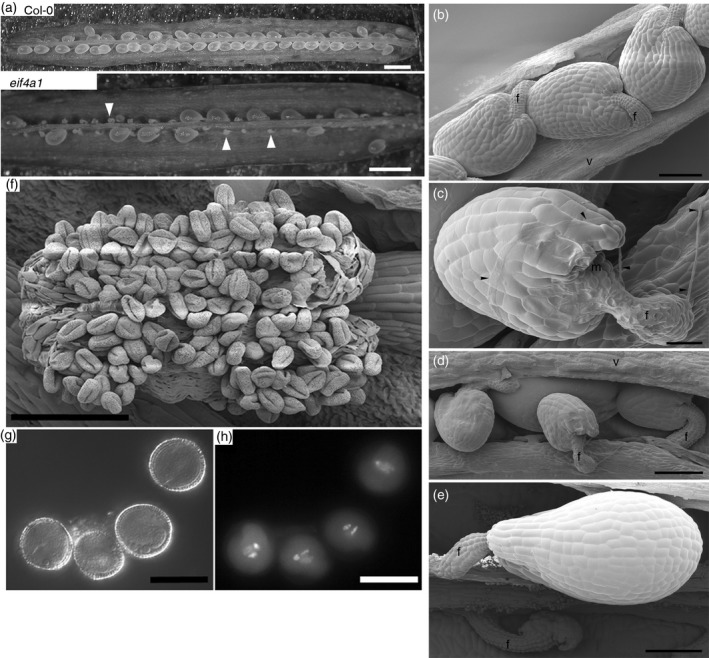
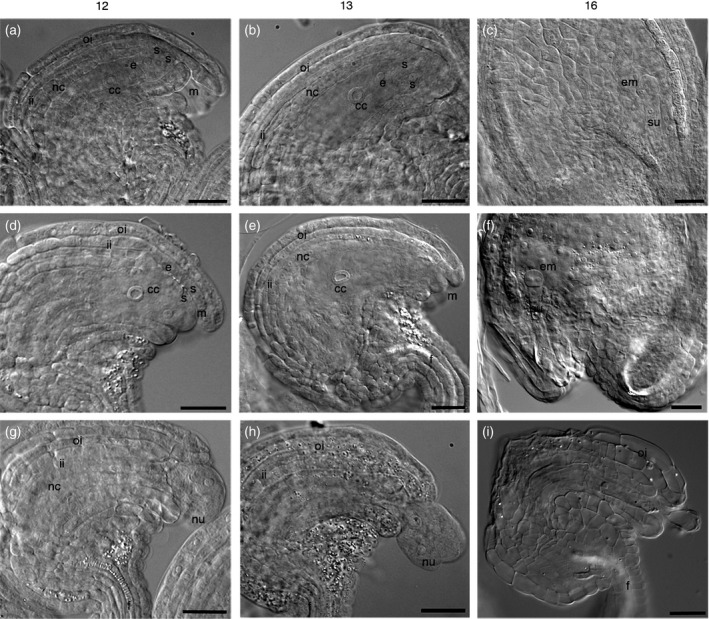
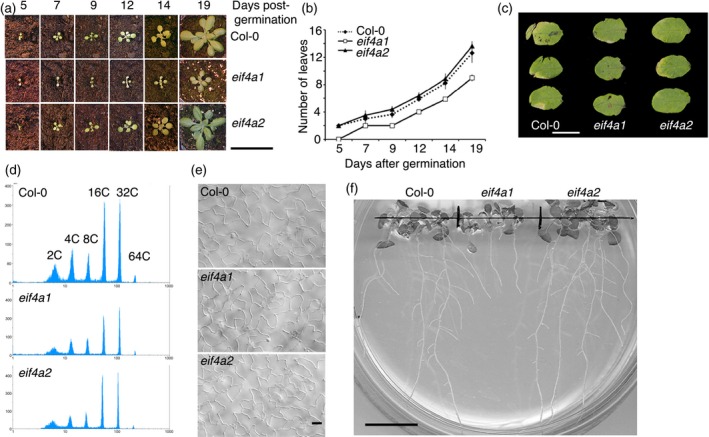
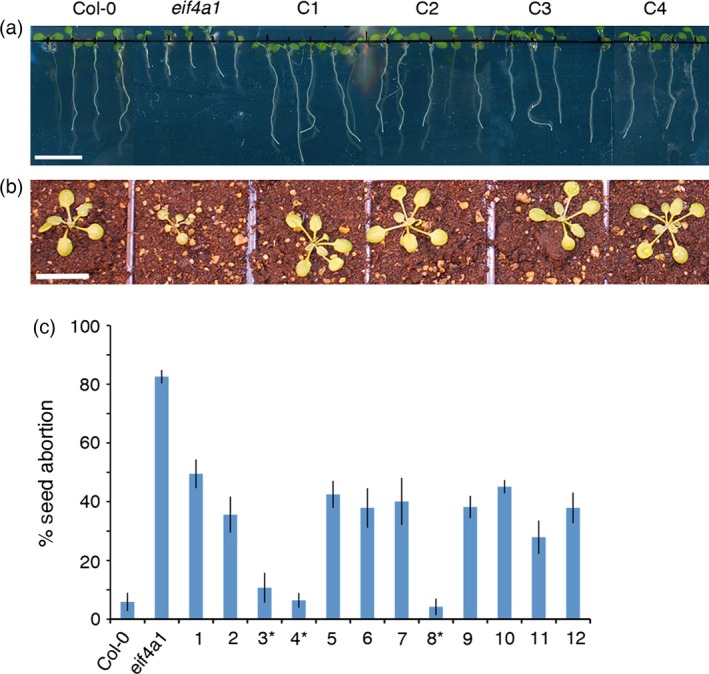
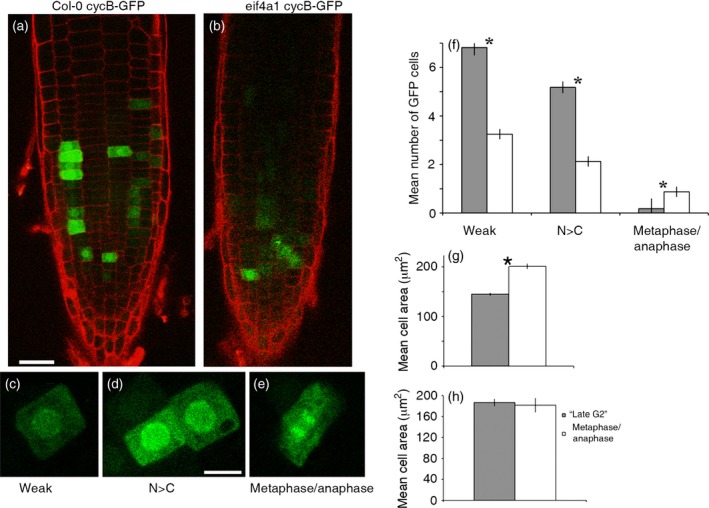
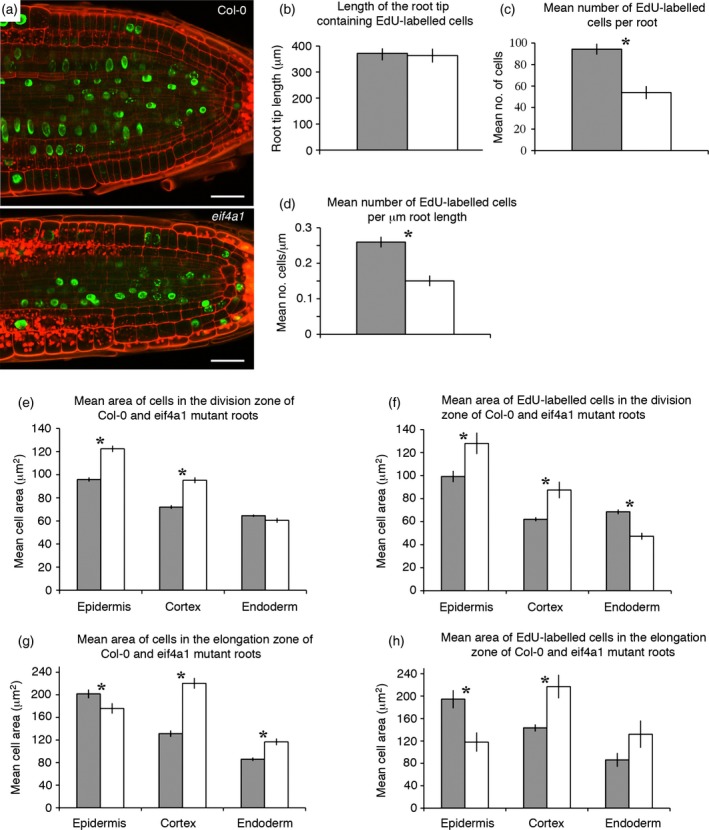
eIF4A is a highly conserved RNA-stimulated ATPase and helicase involved in the initiation of mRNA translation. The Arabidopsis genome encodes two isoforms, one of which (eIF4A-1) is required for the coordination between cell cycle progression and cell size. A T-DNA mutant eif4a1 line, with reduced eIF4A protein levels, displays slow growth, reduced lateral root formation, delayed flowering and abnormal ovule development. Loss of eIF4A-1 reduces the proportion of mitotic cells in the root meristem and perturbs the relationship between cell size and cell cycle progression. Several cell cycle reporter proteins, particularly those expressed at G2/M, have reduced expression in eif4a1 mutant meristems. Single eif4a1 mutants are semisterile and show aberrant ovule growth, whereas double eif4a1 eif4a2 homozygous mutants could not be recovered, indicating that eIF4A function is essential for plant growth and development.

Keywords: Arabidopsis thaliana; DEAD-box helicase; RNA helicase; cell cycle; cell size homeostasis; plant growth; translation factor.


Figures

Figure 1
Figure 1
Identification of eIF4A insertion mutants. (a) Schematic representation of insertional mutation in EIF4A1 and EIF4A2 genes. Primers used for genotyping (Table S1) are indicated by numbered arrowheads. (b) Transcript analysis of eIF4A expression in wild‐type (WT) and mutant strains. RTPCRs using cDNA from Arabidopsis Columbia‐0 WT controls and the eif4a1 and eif4a2 T‐DNA insertion mutants. The APT1 loading control used primers spanning five introns of the APT1 gene, confirming that cDNA samples were free of contaminating genomic DNA and equally loaded. The EIF4A1 transcript is not detectable in the eif4a1 sample using primers spanning the T‐DNA insertion site, but it is present in the WT and eif4a2 mutant. In genomic DNA there is a small intron present, and hence the EIF4A1 gDNA PCR product is slightly larger compared with that of the cDNA products. Likewise, the EIF4A2 transcript is not detected in the eif4a2 sample (EIF4A2), but is in the eif4a1 sample. A partial EIF4A1 transcript from the third exon to the T‐DNA insertion site is detected in the eif4a1 sample (EIF4A1 T‐DNA), suggesting the possibility that a truncated eIF4A‐1 protein could be translated. (c, d) Analysis of eIF4A‐1 protein levels in WT and mutant plants. (c) Silver‐stained SDSPAGE gels of soluble cell protein extracts (SCE) and anti‐wheat eIF4A immunoprecipitations (eIF4A IP) from Columbia‐0 (WT), eif4a1 and eif4a2 plants, and a 2‐day‐old Arabidopsis cell culture (d2) as an internal control. The band intensities indicate similar protein loadings for all plant samples. Duplicate gels were immunoblotted with the anti‐wheat eIF4A antibody (d). (d) Western‐blot analysis of eIF4A levels in mutant and WT plants. The total level of eIF4A (SCE) was reduced in the eif4a1 samples compared with the Col‐0 control, the eif4a2 levels appeared similar to Col‐0. This was reflected in the IP experiment (eIF4A IP upper panel), less eIF4A protein was affinity purified from the eif4a1 samples, whereas that from the eif4a2 samples is similar to Col‐0. In a duplicate experiment (panel below) where more protein was loaded per lane, a smaller band was present only in the eif4a1 sample.
Figure 2
Figure 2
Ovule abortion phenotype of eif4a1 mutant plants. (a) Dissected Col‐0 and eif4a1 siliques. (b–e) Scanning electron micrographs of ovules. (b) Col‐0 ovules of uniform size. (c) Pollen tube (arrowed) growing over an eif4a1 mutant ovule. (d) Three small abnormal ovules overlying a normal ovule in an eif4a1 mutant silique. (e) An abnormal ovule that has disintegrated and a normally developing ovule in an eif4a1 mutant silique. (f) A scanning electron micrograph of a dehiscing eif4a1 mutant anther. (g, h) 4′,6‐Diamidino‐2‐phenylindole (DAPI)‐stained pollen grains seen by Nomarski and epifluorescence microscopy, respectively. Scale bars: (a) 1 mm; (b, d, e, f) 100 μm; (c) 25 μm; (g, h) 15 μm.
Figure 3
Figure 3
Abnormal ovule development in eif4a1 mutant plants. (a–i) Nomarski microscope images of ovules from Col‐0 and eif4a1 mutants at different stages of floral development (stages 12–16; Smyth et al., 1990). (a–c) Col‐0 ovules showing normal development. (d–f) eif4a1 mutant ovules developing normally. (g–i) eif4a1 mutant ovules developing abnormally. (a, d) In normal development, the integuments surround the nucellus. (g, h) The nucellus in some eif4a1 ovules is extruded from the embryo sac. (b, e) The ovule enlarges slightly, and the micropyle curves around towards the funiculus. (c, f, i) After fertilization, embryos can be seen in normally developing ovules, whereas some eif4a1 ovules show tissue degradation. Abbreviations: cc, central cell; e, egg cell; em, embryo; f, funiculus; ii, inner integument; m, micropyle; nc, nucellar cells; nu, nucellus being extruded; oi, outer integument; s, synergid; su, suspensor. Scale bars: 25 μm.
Figure 4
Figure 4
Phenotype of eif4a1 mutant plants. (a) Photographs of Col‐0, eif4a1 and eif4a2 plants taken at different stages of vegetative growth. (b) Graph of mean leaf initiation rate after germination. (c) Leaf development in Col‐0, eif4a1 and eif4a2. Images of the adaxial surface of mature fifth rosette leaves sampled 23 days after initiation. (d) Flow cytometric analyses of mature fifth leaves sampled 23 days after initiation from Col‐0, eif4a1 and eif4a2 plants. C values are indicated on uppermost graph. (e) Nomarski images of adaxial pavement cells of mature fifth leaves sampled 23 days after initiation from Col‐0, eif4a1 and eif4a2 plants. (f) Root morphology in Col‐0, eif4a1 and eif4a2 seedlings grown vertically on phytagel for 9 days. The eif4a1 roots are short and lack lateral roots. Scale bars: (a) 50 mm; (c) 10 mm; (e) 50 μm; (f) 20 mm.
Figure 5
Figure 5
Functional complementation of the eif4a1 mutant. (a) Complementation of the root phenotype in eif4a1 with a genomic copy of EIF4A1. From the left, Col‐0 seedlings, eif4a1 mutant seedlings and four independent lines (C1–C4) of eif4a1 mutants complemented with EIF4A‐1(p)::EIF4A‐1. (b) Functional complementation of the aerial phenotype. Plants are labeled as in (a). (c) Complementation of the ovule abortion phenotype. From the left, Col‐0, eif4a1 mutant and 12 independent complemented lines of the eif4a1 mutant (1–12); *lines homozygous for the complemented construct. Scale bars: (a) 10 mm; (b) 20 mm.
Figure 6
Figure 6
Confocal scanning microscope images of root tips expressing a cyclin B1‐1::GFP reporter. (a) Col‐0 and (b) eif4a1 roots. (c–e) Cells expressing different patterns of cyclin B1‐1::GFP as they progress through mitosis; N > C indicates stronger nuclear labelling compared with the cytoplasm; metaphase/anaphase includes cells where the chromatin is stained and aligned on the metaphase plate or has separated. (f) Histograms showing the mean numbers of cyclin B::GFP‐positive root tip cells labelled according to this classification in Col‐0 (grey bars) and eif4a1 (white bars) backgrounds. (g) Mean cell areas of cyclin B::GFP‐expressing cells from Col‐0 (grey bars) and eif4a1 (white bars) mutant roots. (h) Mean areas of ‘late G2’ cells (grey bars) and ‘metaphase/anaphase’ cells (white bars) in eif4a1 roots expressing cyclin B::GFP. Asterisks in (f–h) indicate significant differences according to Student's t‐tests. Scale bars: (a) 30 μm, also applies to (b); (c–e) 10 μm.
Figure 7
Figure 7
Image analysis data from EdU‐Schiff propidium iodide‐stained and cyclin B::GFP‐expressing roots. (a) Confocal scanning microscope images through the quiescent centre and division zone of EdU‐Schiff propidium iodide‐labelled roots of Col‐0 and eif4a1 mutants. (b–h) Histograms comparing various parameters of Col‐0 (grey bars) and eif4a1 (white bars) mutant roots labelled with EdU and Schiff propidium iodide. Asterisks in (c–h) indicate significant differences as shown by Student's t tests.

References

    1. Andreou, A.Z. and Klostermeier, D. (2013) The DEAD‐box helicase eIF4A: paradigm or the odd one out? RNA Biol. 10, 19–32. - PMC - PubMed
    1. Bhat, M. , Robichaud, N. , Hulea, L. , Sonenberg, N. , Pelletier, J. and Topisirovic, I. (2015) Targeting the translation machinery in cancer. Nat. Rev. Drug Discov. 14, 261–278. - PubMed
    1. Bleckmann, A. , Alter, S. and Dresselhaus, T. (2014) The beginning of a seed: regulatory mechanisms of double fertilization. Front. Plant Sci. 5, 452. - PMC - PubMed
    1. Boex‐Fontvieille, E. , Daventure, M. , Jossier, M. , Zivy, M. , Hodges, M. and Tcherkez, G. (2013) Photosynthetic control of Arabidopsis leaf cytoplasmic translation initiation by protein phosphorylation. PLoS ONE, 8, e70692. - PMC - PubMed
    1. Bordeleau, M.E. , Cencic, R. , Lindqvist, L. , Oberer, M. , Northcote, P. , Wagner, G. and Pelletier, J. (2006a) RNA‐mediated sequestration of the RNA helicase eIF4A by Pateamine A inhibits translation initiation. Chem. Biol. 13, 1287–1295. - PubMed

Publication types

MeSH terms

LinkOut - more resources