

De novo assembly and sex-specific transcriptome profiling in the sand fly Phlebotomus perniciosus (Diptera, Phlebotominae), a major Old World vector of Leishmania infantum
- PMID: 26493315
- PMCID: PMC4619268
- DOI: 10.1186/s12864-015-2088-x
De novo assembly and sex-specific transcriptome profiling in the sand fly Phlebotomus perniciosus (Diptera, Phlebotominae), a major Old World vector of Leishmania infantum
Abstract
Background: The phlebotomine sand fly Phlebotomus perniciosus (Diptera: Psychodidae, Phlebotominae) is a major Old World vector of the protozoan Leishmania infantum, the etiological agent of visceral and cutaneous leishmaniases in humans and dogs, a worldwide re-emerging diseases of great public health concern, affecting 101 countries. Despite the growing interest in the study of this sand fly species in the last years, the development of genomic resources has been limited so far. To increase the available sequence data for P. perniciosus and to start studying the molecular basis of the sexual differentiation in sand flies, we performed whole transcriptome Illumina RNA sequencing (RNA-seq) of adult males and females and de novo transcriptome assembly.
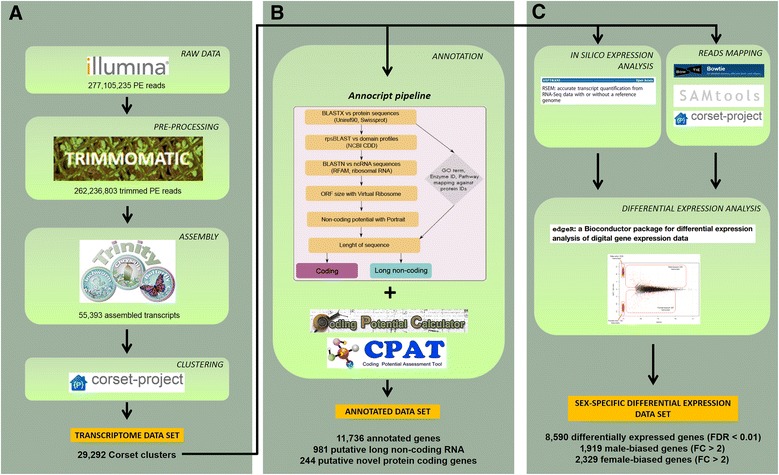
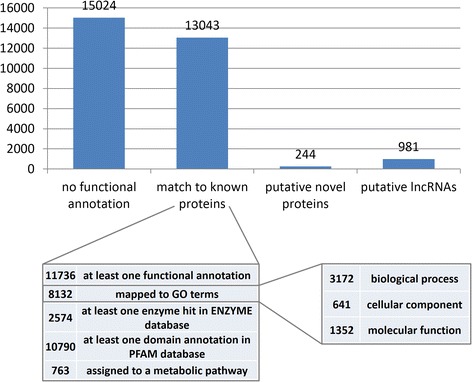
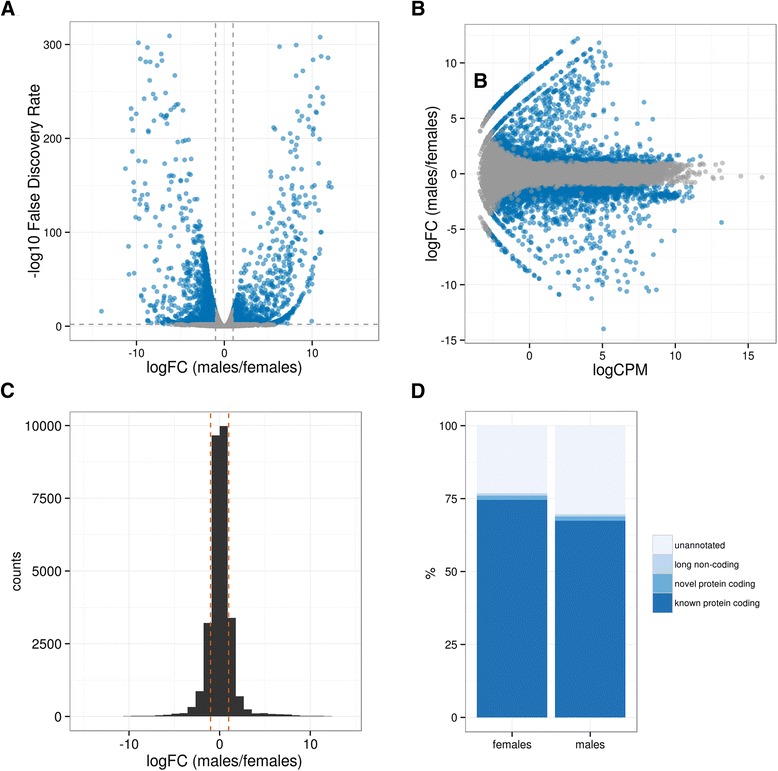
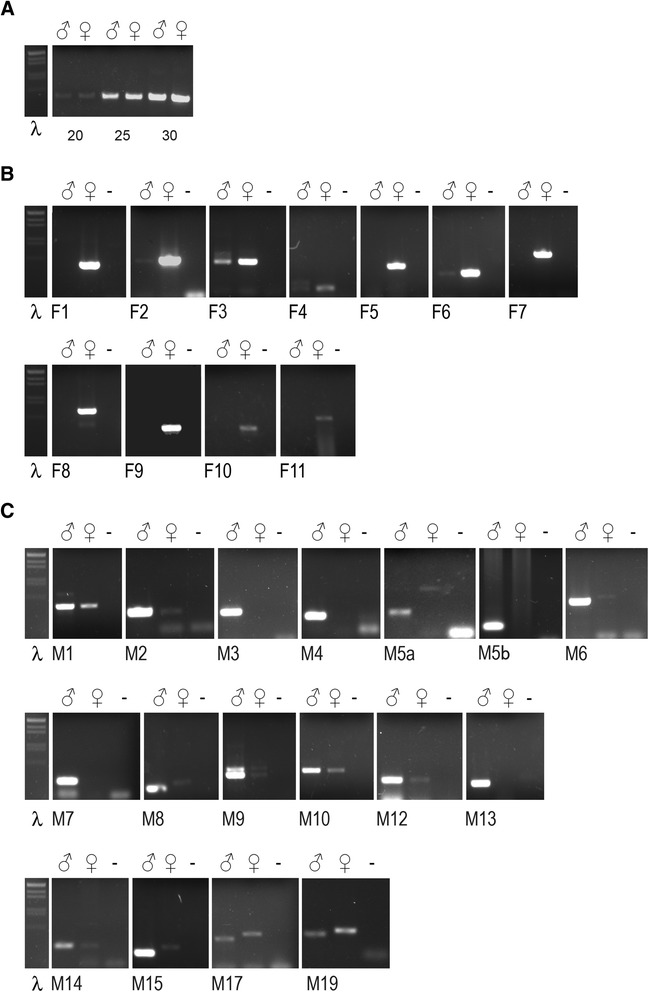
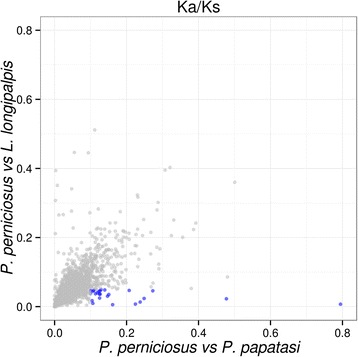
Results: We assembled 55,393 high quality transcripts, of which 29,292 were unique, starting from adult whole body male and female pools. 11,736 transcripts had at least one functional annotation, including full-length low abundance salivary transcripts, 981 transcripts were classified as putative long non-coding RNAs and 244 transcripts encoded for putative novel proteins specific of the Phlebotominae sub-family. Differential expression analysis identified 8590 transcripts significantly biased between sexes. Among them, some show relaxation of selective constraints when compared to their orthologs of the New World sand fly species Lutzomyia longipalpis.
Conclusions: In this paper, we present a comprehensive transcriptome resource for the sand fly species P. perniciosus built from short-read RNA-seq and we provide insights into sex-specific gene expression at adult stage. Our analysis represents a first step towards the identification of sex-specific genes and pathways and a foundation for forthcoming investigations into this important vector species, including the study of the evolution of sex-biased genes and of the sexual differentiation in phlebotomine sand flies.
Figures
Similar articles
-
The midgut transcriptome of Phlebotomus (Larroussius) perniciosus, a vector of Leishmania infantum: comparison of sugar fed and blood fed sand flies.BMC Genomics. 2011 May 10;12:223. doi: 10.1186/1471-2164-12-223. BMC Genomics. 2011. PMID: 21569254 Free PMC article.
-
Phlebotomine sand fly survey in the focus of leishmaniasis in Madrid, Spain (2012-2014): seasonal dynamics, Leishmania infantum infection rates and blood meal preferences.Parasit Vectors. 2017 Aug 1;10(1):368. doi: 10.1186/s13071-017-2309-z. Parasit Vectors. 2017. PMID: 28764772 Free PMC article.
-
Sand fly and Leishmania spp. survey in Vojvodina (Serbia): first detection of Leishmania infantum DNA in sand flies and the first record of Phlebotomus (Transphlebotomus) mascittii Grassi, 1908.Parasit Vectors. 2017 Sep 26;10(1):444. doi: 10.1186/s13071-017-2386-z. Parasit Vectors. 2017. PMID: 28950895 Free PMC article.
-
Controlling phlebotomine sand flies to prevent canine Leishmania infantum infection: A case of knowing your enemy.Res Vet Sci. 2018 Dec;121:94-103. doi: 10.1016/j.rvsc.2018.10.008. Epub 2018 Oct 13. Res Vet Sci. 2018. PMID: 30366124 Review.
-
The knowns and unknowns of the efficacy of neem oil (Azadirachta indica) used as a preventative measure against Leishmania sand fly vectors (Phlebotomus genus).Prev Vet Med. 2022 May;202:105618. doi: 10.1016/j.prevetmed.2022.105618. Epub 2022 Mar 19. Prev Vet Med. 2022. PMID: 35349879 Review.
Cited by
-
Optimization of sand fly embryo microinjection for gene editing by CRISPR/Cas9.PLoS Negl Trop Dis. 2018 Sep 4;12(9):e0006769. doi: 10.1371/journal.pntd.0006769. eCollection 2018 Sep. PLoS Negl Trop Dis. 2018. PMID: 30180160 Free PMC article.
-
Tissue-specific transcriptomes of Anisakis simplex (sensu stricto) and Anisakis pegreffii reveal potential molecular mechanisms involved in pathogenicity.Parasit Vectors. 2018 Jan 10;11(1):31. doi: 10.1186/s13071-017-2585-7. Parasit Vectors. 2018. PMID: 29321072 Free PMC article.
-
Functional Intricacy and Symmetry of Long Non-Coding RNAs in Parasitic Infections.Front Cell Infect Microbiol. 2021 Oct 8;11:751523. doi: 10.3389/fcimb.2021.751523. eCollection 2021. Front Cell Infect Microbiol. 2021. PMID: 34692567 Free PMC article. Review.
-
Genome-wide analysis of long non-coding RNAs in adult tissues of the melon fly, Zeugodacus cucurbitae (Coquillett).BMC Genomics. 2020 Aug 31;21(1):600. doi: 10.1186/s12864-020-07014-x. BMC Genomics. 2020. PMID: 32867696 Free PMC article.
-
Evolutionary Plasticity in Insular Lizard, Adapting over Reproduction, Metabolism, and Color Variation.Biology (Basel). 2023 Nov 30;12(12):1478. doi: 10.3390/biology12121478. Biology (Basel). 2023. PMID: 38132304 Free PMC article.
References
-
- Gradoni L. Epidemiological surveillance of leishmaniasis in the European Union: operational and research challenges. Euro Surveill. 2013;18(30):20539. - PubMed
-
- Depaquit J, Grandadam M, Fouque F, Andry PE, Peyrefitte C. Arthropod-borne viruses transmitted by Phlebotomine sandflies in Europe: a review. Euro Surveill. 2010;15(10):19507. - PubMed
Publication types
MeSH terms
LinkOut - more resources
Full Text Sources
Other Literature Sources
