. 2015 Oct 23:6:8562.
doi: 10.1038/ncomms9562.

Coral record of southeast Indian Ocean marine heatwaves with intensified Western Pacific temperature gradient

Affiliations

Coral record of southeast Indian Ocean marine heatwaves with intensified Western Pacific temperature gradient

J Zinke et al. Nat Commun. .

Abstract

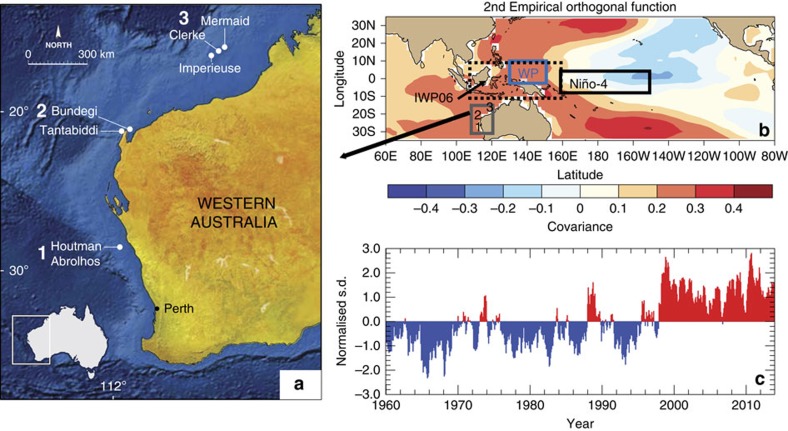
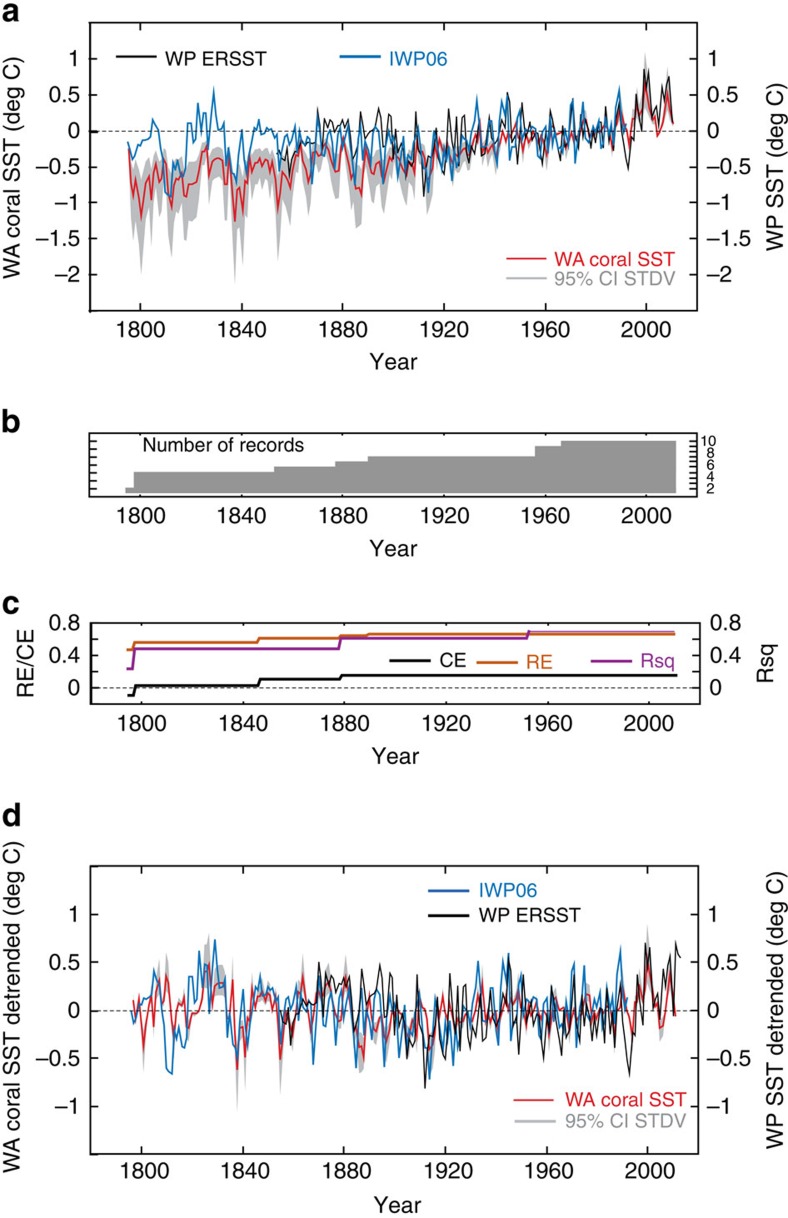
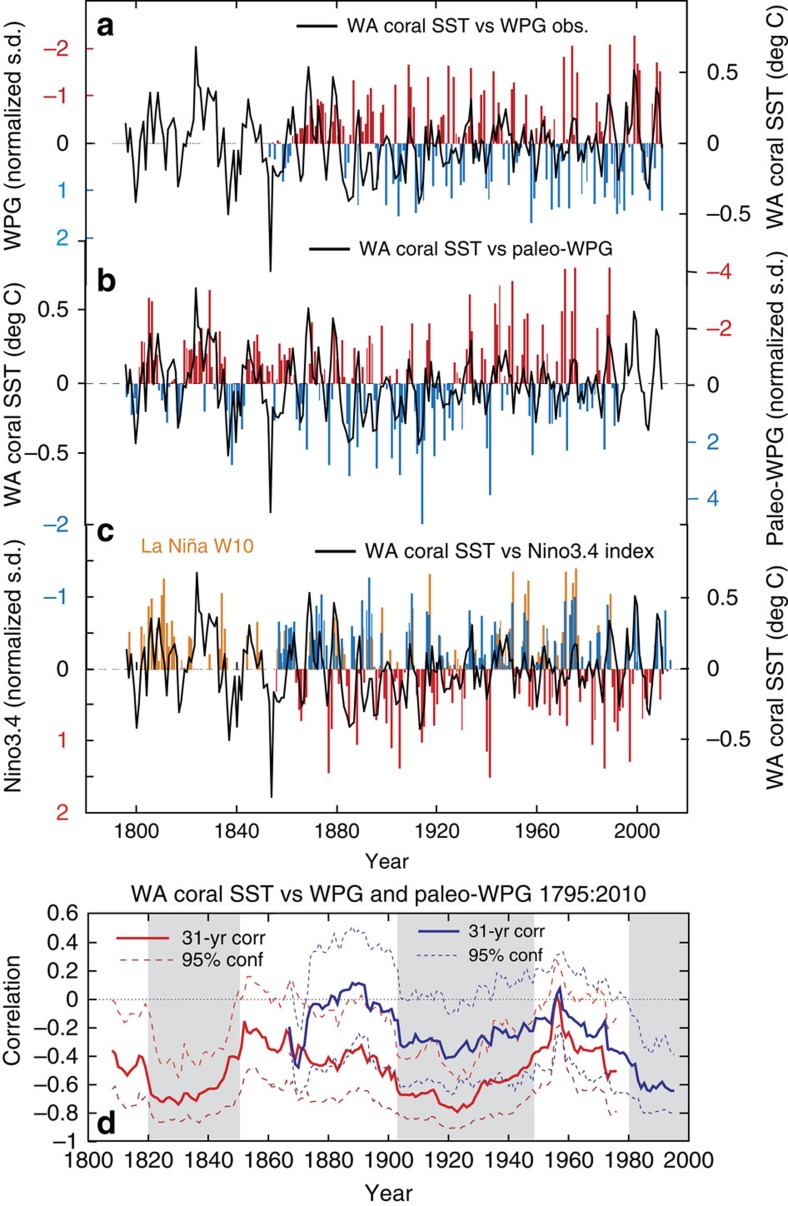
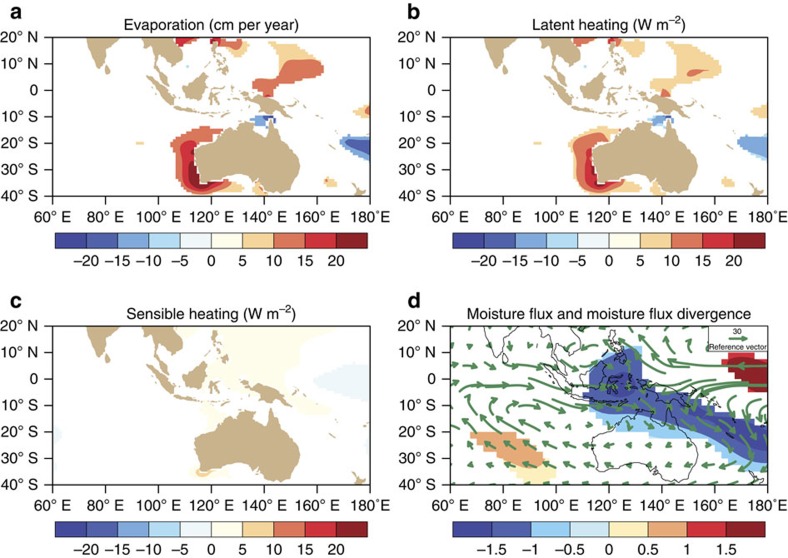
Increasing intensity of marine heatwaves has caused widespread mass coral bleaching events, threatening the integrity and functional diversity of coral reefs. Here we demonstrate the role of inter-ocean coupling in amplifying thermal stress on reefs in the poorly studied southeast Indian Ocean (SEIO), through a robust 215-year (1795-2010) geochemical coral proxy sea surface temperature (SST) record. We show that marine heatwaves affecting the SEIO are linked to the behaviour of the Western Pacific Warm Pool on decadal to centennial timescales, and are most pronounced when an anomalously strong zonal SST gradient between the western and central Pacific co-occurs with strong La Niña's. This SST gradient forces large-scale changes in heat flux that exacerbate SEIO heatwaves. Better understanding of the zonal SST gradient in the Western Pacific is expected to improve projections of the frequency of extreme SEIO heatwaves and their ecological impacts on the important coral reef ecosystems off Western Australia.


Figures

Figure 1
Figure 1. Southeast Indian Ocean reefs and tropical Indo-Pacific SST variability.
(a) Locations of the three reef areas (1–3) sampled for long coral cores, (b) rotated empirical orthogonal function 2 (REOF2) covariance of ERSSTv3b anomalies, and (c) REOF2 time series, 1960–2013, which explains 21% of the variance. The WPG is defined as the standardized difference between average SST over the Niño4 domain (black box) and the Western Pacific (WP; blue box), while the Western Australian region is highlighted in grey with coral sampling locations indicated, 1, Houtman Abrolhos, 2, Ningaloo Reef and 3, Rowley Shoals. The black-dashed box marks the Indonesian warm pool region (IWP06 (ref. 26)).
Figure 2
Figure 2. Southeast Indian Ocean coral SST anomaly reconstruction and Western Pacific SST anomalies.
(a) Reconstructed annual WA coral SST anomaly (red) with 95% confidence interval (grey shaded) based on the spread of both coral and ERSST standard deviations between 1961 and 1990 compared with Indonesian warm pool (IWP06; blue) and WP SST anomaly reconstructions (WP ERSST; black). SST anomalies are relative to 1961–1990 mean, (b) Number of coral cores through time, (c) Reconstruction skill statistics for WA coral SST against regional ERSST (17–28° S, 113–119° E) are calculated over the validation period (1920–1949) for each proxy nest, including the coefficient of determination (Rsq, magenta), the reduction of error (RE, orange), and the coefficient of efficiency (CE, black) and (d) Same as a, but detrended time series.
Figure 3
Figure 3. Western Pacific Gradient—SEIO SST relationship.
(a) WPG from observations (y axis inverted) compared to detrended WA coral SST, (b) paleo-WPG based on the difference between IWP06 (ref. 26) and Niño3.4 reconstruction, (c) Niño3.4 instrumental index (blue= La Niña; red= El Niño) and La Niña-like anomalies in the Niño3.4 reconstruction superimposed (orange), and (d) 31-year running correlations between detrended WA coral SST and paleo-WPG (red solid line, red stippled 95% confidence interval based on a 1,000-sample Monte Carlo simulation58) and WPG from observations (purple solid line, purple stippled 95% confidence interval). Grey shaded areas indicates periods with statistically significant correlations (>95%).
Figure 4
Figure 4. Heat and energy flux terms related to changes in the West Pacific gradient.
(a) Surface ocean evaporation, (b) latent heat flux, (c) sensible heat flux and (d) vertically integrated moisture flux (kg m−1 s−1) and moisture flux divergence (coloured) related to the change in the WPG between 1958 and 2012 (ref. 33). (ad) show the flux relationship as composites between negative and positive WPG gradient occurrences. The number of positive and negative occurrences are 8 (16 in total), which correspond to 33% of the 58-year record. Positive flux in a to c means the ocean is gaining heat. All shadings in (ad) are significant to P<0.05 using a two-tailed Monte Carlo test.

References

    1. Condie S. A. & Andrewartha J. R. Circulation and connectivity on the Australian North West Shelf. Cont. Shelf Res. 28, 1724 (2008) .
    1. D'Adamo N., Fandry C., Buchan S. & Domingues C. Northern Sources of the Leeuwin Current and the ‘Holloway Current' on the North West Shelf. J. Roy. Soc. WA 92, 53 (2009) .
    1. Feng M., McPhaden M. J., Xie S. P. & Hafner J. La Niña forces unprecedented Leeuwin Current warming in 2011. Sci. Rep. 3, 1277 (2013) . - PMC - PubMed
    1. Moore J. A. et al. Unprecedented Mass Bleaching and Loss of Coral across 12° of Latitude in Western Australia in 2010–11. PLoS ONE 7, e51807 (2012) . - PMC - PubMed
    1. Wernberg T. et al. An extreme climate event alters marine ecosystem structure in a global biodiversity hotspot. Nat. Clim. Change 3, 78–82 (2012) .

Publication types

LinkOut - more resources