. 2015 Oct 23:16:339.
doi: 10.1186/s12859-015-0776-9.

PDB-Explorer: a web-based interactive map of the protein data bank in shape space

Affiliations

PDB-Explorer: a web-based interactive map of the protein data bank in shape space

Xian Jin et al. BMC Bioinformatics. .

Abstract

Background: The RCSB Protein Data Bank (PDB) provides public access to experimentally determined 3D-structures of biological macromolecules (proteins, peptides and nucleic acids). While various tools are available to explore the PDB, options to access the global structural diversity of the entire PDB and to perceive relationships between PDB structures remain very limited.

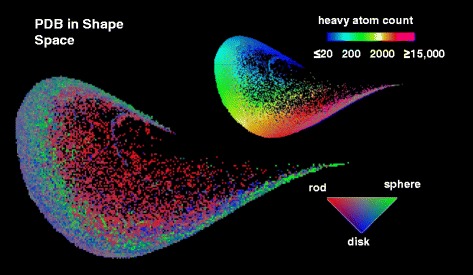
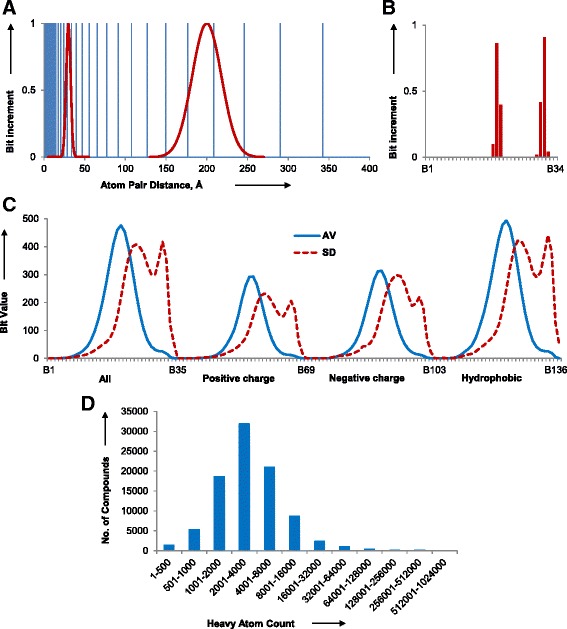
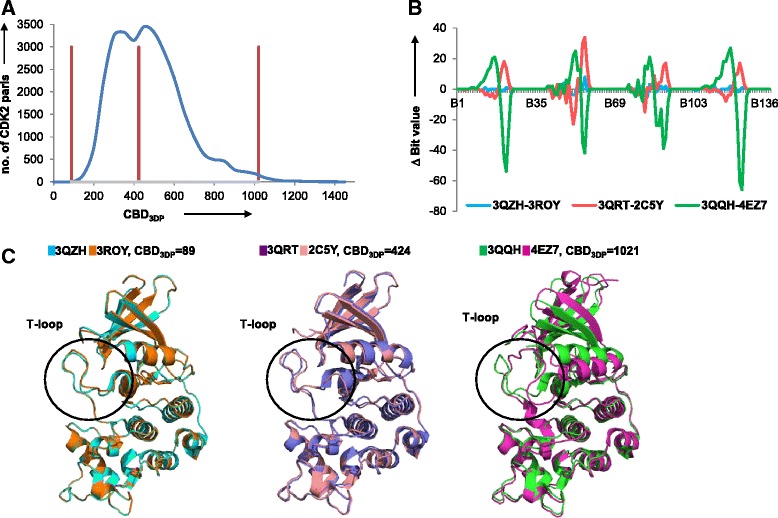
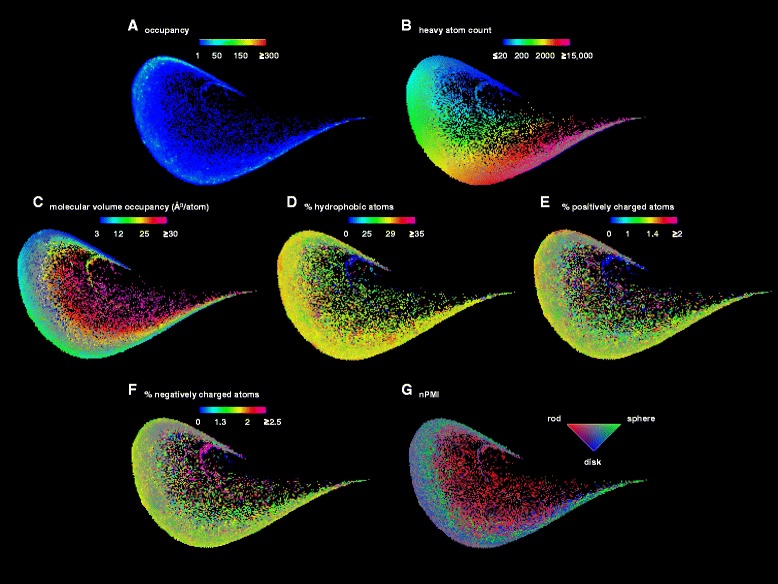
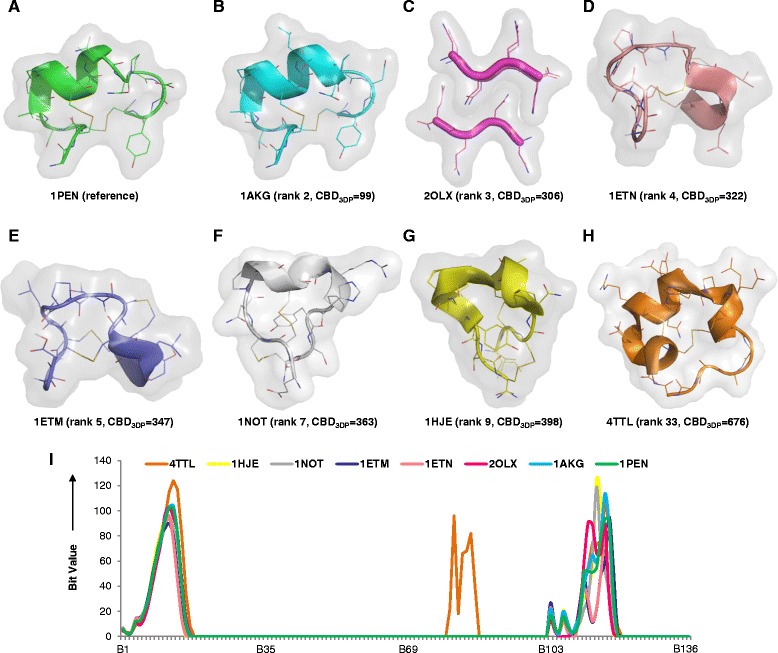
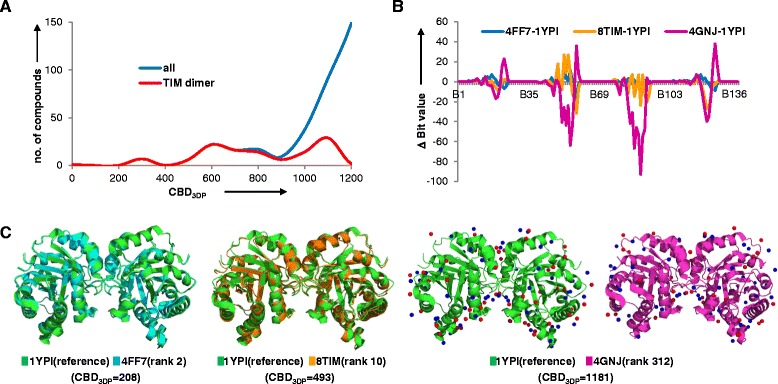
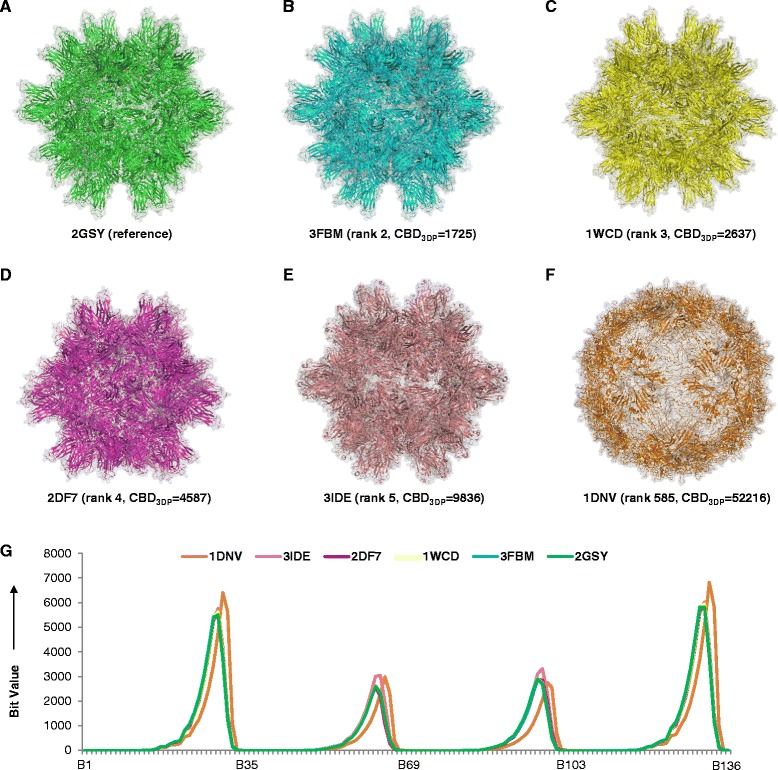
Methods: A 136-dimensional atom pair 3D-fingerprint for proteins (3DP) counting categorized atom pairs at increasing through-space distances was designed to represent the molecular shape of PDB-entries. Nearest neighbor searches examples were reported exemplifying the ability of 3DP-similarity to identify closely related biomolecules from small peptides to enzyme and large multiprotein complexes such as virus particles. The principle component analysis was used to obtain the visualization of PDB in 3DP-space.

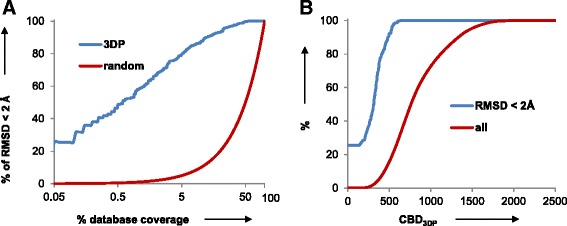
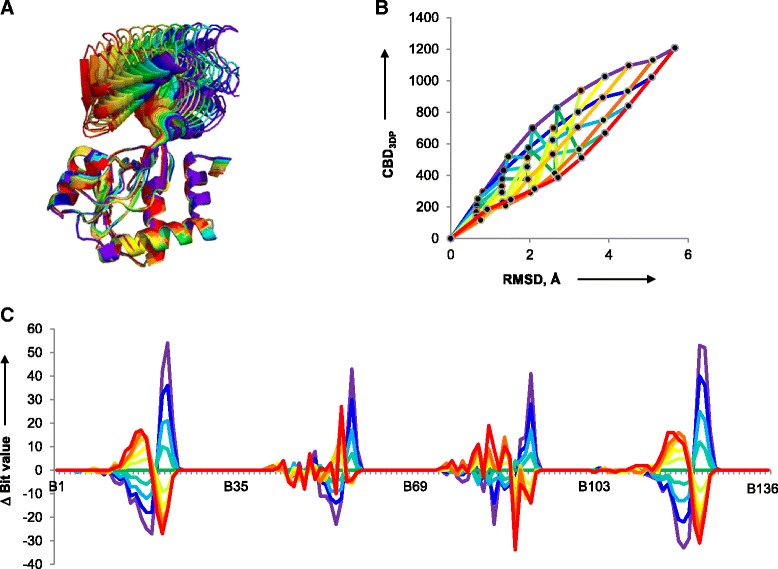
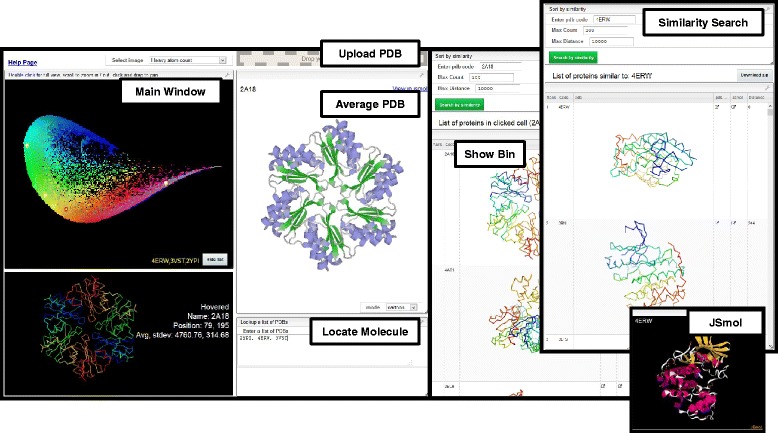
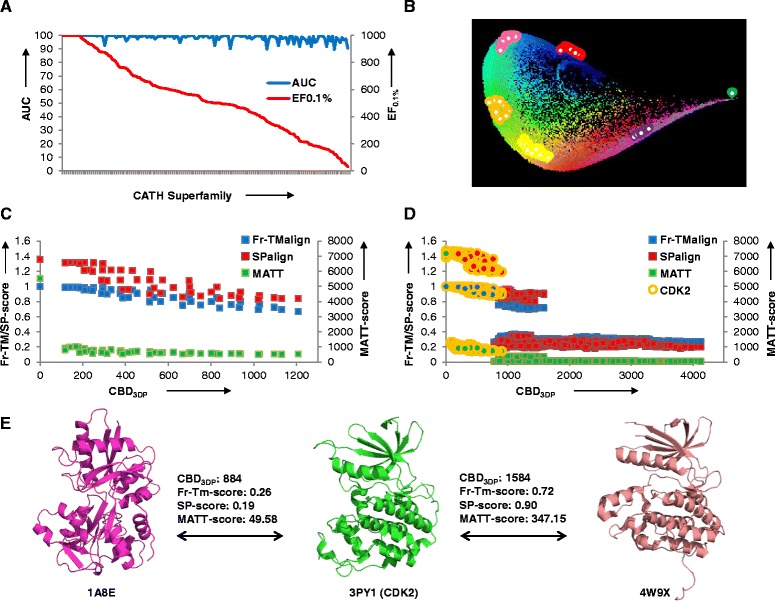
Results: The 3DP property space groups proteins and protein assemblies according to their 3D-shape similarity, yet shows exquisite ability to distinguish between closely related structures. An interactive website called PDB-Explorer is presented featuring a color-coded interactive map of PDB in 3DP-space. Each pixel of the map contains one or more PDB-entries which are directly visualized as ribbon diagrams when the pixel is selected. The PDB-Explorer website allows performing 3DP-nearest neighbor searches of any PDB-entry or of any structure uploaded as protein-type PDB file. All functionalities on the website are implemented in JavaScript in a platform-independent manner and draw data from a server that is updated daily with the latest PDB additions, ensuring complete and up-to-date coverage. The essentially instantaneous 3DP-similarity search with the PDB-Explorer provides results comparable to those of much slower 3D-alignment algorithms, and automatically clusters proteins from the same superfamilies in tight groups.

Conclusion: A chemical space classification of PDB based on molecular shape was obtained using a new atom-pair 3D-fingerprint for proteins and implemented in a web-based database exploration tool comprising an interactive color-coded map of the PDB chemical space and a nearest neighbor search tool. The PDB-Explorer website is freely available at www.cheminfo.org/pdbexplorer and represents an unprecedented opportunity to interactively visualize and explore the structural diversity of the PDB. ᅟ


Figures

Graphical abstract
Graphical abstract
ᅟMaps of PDB in 3DP-space color-coded by heavy atom count and shape.
Fig. 1
Fig. 1
3DP fingerprint design. a 34 sampling values between 1.45 and 400 Å (blue vertical bars) and example Gaussian corresponding to two atom pair distances (red line). b Sampling of bit values of B1–B34 for the atom pairs at 30 and 200 Å from the Gaussian functions in a. c Average (AV, blue continuous line) and standard deviation (SD, red doted line) of bit values of 3DP for all biological assemblies in the PDB. d Distribution of heavy atom count (HAC) values in the PDB. The analysis is based on 91,223 X-ray structures downloaded from the PDB in September 2014, considering in each case the biological assembly as defined by the authors
Fig. 2
Fig. 2
Retrieval of conformer analogs from the MD trajectory of a 24 residue peptide by 3DP similarity. a ROC curve for retrieving structures with RMSD < 2 Å, relative the last frame in a 50 ns MD simulation taken as reference, by 3DP similarity (blue) and by random selection (red), averaged over 50 different MD simulations. b Recovery of structures with RMSD < 2 Å to the reference (blue) and all structures (red) as function of CBD3DP from the reference. The structure alignment and RMSD calculation of all heavy atoms were carried out with the AMBER12 package. The sequence of the 24-mer peptide is MKKRLAYAIIQFLHDQLRHGGLSS
Fig. 3
Fig. 3
Correlation between RMSD and CBD3DP in conformers of the glutamine binding protein. a Overlay of 10 structures from domain movement of glutamine binding protein taken from the Protein Motion Database. The initial structure is PDB-entry 1GGG (purple) and last structure is PDB-entry 1WDN (red). b Correlation between RMSD from all heavy atom alignment and CBD3DP. Each line indicates different reference structure. Purple: 1st (1GGG); Blue: 2nd; Cyan: 3rd; Lime Green: 4th; Green: 5th; Light green: 6th; Yellow: 7th; Yellow orange: 8th; Orange: 9th; Red: 10th (1WDN). c Deviation of bit values to the 5th structure
Fig. 4
Fig. 4
3DP distinguishes between closely related CDK2 T-loop conformers. a Frequency histogram of pairwise CBD3DP values from 245 CDK2 conformations (blue). b Three pairs of CKD2s, 3QZH-3ROY, 3QRT-2C5Y, and 3QQH-4EZ7, were analyzed. They had CBD3DP values 89 (left red bar in a), 424 (middle red bar in a) and 1021 (right red bar in a) respectively. Differences of bit values are shown for 3QZH-3ROY (blue), 3QRT-2C5Y (red), and 3QQH-4EZ7 (green). c Alignment of 3QZH (blue) and 3ROY (orange); 3QRT (slate blue) and 2C5Y (coral); 3QQH (green) and 4EZ7 (magenta)
Fig. 5
Fig. 5
PDB-maps of 3DP-similarity space color-coded by (a) occupancy, (b) heavy atom count, (c) molecular volume occupancy (mvo), (d) percentage of hydrophobic atoms, (e) percentage of positively charged atoms, (f) percentage of negatively charged atoms. The color-coding is from blue (lowest values) to magenta (highest values). (g) PDB-map color-coded by nPMI values. The rod-like structures are red color; the spherical structures are green color; the disc-like structures are blue color. The maps were computed from 91,223 X-ray structures from the PDB downloaded in September 2014, considering in each case the biological assembly as defined by the author
Fig. 6
Fig. 6
Interface of PDB-Explorer website. Main window: color-coded similarity map of PDB in 3DP-similarity space, with image of the protein in the pixel marked by the mouse cursor on the map. Upload PDB: place to load a user-defined PDB-file to be shown on the 3DP-similarity map (structure must contain properly annotated atoms). Average PDB: interactive 3D-view of the molecule corresponding to the most average entry in selected pixel. Locate Molecule: interface to type PDB entry codes to be shown on the map. Show Bin: full list of all proteins contain in the selected pixel. Similarity Search: window to enter PDB-code and search for nearest neighbours in 3DP-space, and display of the nearest neighbour list. JSmol: 3D-display of selected entry
Fig. 7
Fig. 7
Analogs of α-conotoxin 1PEN retrieved by 3DP similarity. a Reference molecule, 1PEN. b-h Structures of selected nearest neighbors and CBD3DP to the reference. i Bit value profiles of conotoxins and analogs
Fig. 8
Fig. 8
Similarity search result for triose phosphate isomerase (TIM) dimer, 1YPI. a Frequency histogram of CBD3DP between all of the structures in PDB and 1YPI (blue), and all of the TIM dimers and 1YPI (red). b Deviation of bit values of 4FF7, 8TIM and 4GNJ to the reference 1YPI. c Comparison of the structures of reference 1YPI and rank2, rank10 and rank 321 analogs retrieved from similarity search. The positively charged atoms are shown as blue spheres and negatively charged atoms are shown as red spheres for 1YPI and 4GNJ
Fig. 9
Fig. 9
Similarity search result for virus capsid, 2GSY. a-e The structures of reference and top 4 analogs retrieved from similarity search. f Parvovirus capsid protein, 1DNV. g Bit values of compounds a-f
Fig. 10
Fig. 10
Classification of CATH superfamilies in 3DP-space and comparison of 3DP with structural alignment tools Fr-TMalign, SPalign and MATT. a AUC and EF0.1% values for ROC curves recovering 150 CATH superfamilies from the entire PDB by 3DP-similarity. b Locations of 6 CATH superfamilies (1.10.246.10, 2.30.30.40, 2.60.120.20, 3.10.320.10, 3.40.50.200 and 3.40.309.10) on the PDB-map. c Correlation between alignment scores (Fr-TMalign, SPalign, MATT) and CBD3DP obtained from 10 domain movement frames of the glutamine binding protein (Fig. 3). Red square: Fr-TMalign; Blue square: SPalign; Green square: MATT. d Correlation between alignment scores (Fr-TMalign, SPalign, MATT) and CBD3DP for 50 CDK2 and 50 decoys (1225 CDK2 pairs and 2500 CDK2-decoy cross-pairs). Red square: Fr-TMalign; Blue square: SPalign; Green square: MATT; Orange circle: CDK2 proteins. e Example of shape analogs of the CDK2 protein 3PY1 identified by 3DP-similarity or 3D-alignment tools. 1A8E is detected as shape analog of 3PY1 by 3DP similarity, but not by any of the three alignment tools. 4W9X is similar to 3PY1 in each of the three alignment tools, but is not a close analog by 3DP similarity

References

    1. Rose PW, Bi C, Bluhm WF, Christie CH, Dimitropoulos D, Dutta S, Green RK, Goodsell DS, Prlic A, Quesada M, et al. The RCSB Protein Data Bank: new resources for research and education. Nucleic Acids Res. 2013;41:D475–D482. doi: 10.1093/nar/gks1200. - DOI - PMC - PubMed
    1. Gutmanas A, Alhroub Y, Battle GM, Berrisford JM, Bochet E, Conroy MJ, Dana JM, Fernandez Montecelo MA, van Ginkel G, Gore SP, et al. PDBe: Protein Data Bank in Europe. Nucleic Acids Res. 2014;42:D285–D291. doi: 10.1093/nar/gkt1180. - DOI - PMC - PubMed
    1. Rose PW, Prlic A, Bi C, Bluhm WF, Christie CH, Dutta S, Green RK, Goodsell DS, Westbrook JD, Woo J, et al. The RCSB Protein Data Bank: views of structural biology for basic and applied research and education. Nucleic Acids Res. 2015;43:D345–D356. doi: 10.1093/nar/gku1214. - DOI - PMC - PubMed
    1. Touw WG, Baakman C, Black J, Te Beek TA, Krieger E, Joosten RP, Vriend G. A series of PDB-related databanks for everyday needs. Nucleic Acids Res. 2015;43:D364–D368. doi: 10.1093/nar/gku1028. - DOI - PMC - PubMed
    1. Andreeva A, Howorth D, Chandonia JM, Brenner SE, Hubbard TJ, Chothia C, Murzin AG. Data growth and its impact on the SCOP database: new developments. Nucleic Acids Res. 2008;36:D419–D425. doi: 10.1093/nar/gkm993. - DOI - PMC - PubMed

Publication types