

A genetic framework for H2O2 induced cell death in Arabidopsis thaliana
- PMID: 26493993
- PMCID: PMC4619244
- DOI: 10.1186/s12864-015-1964-8
A genetic framework for H2O2 induced cell death in Arabidopsis thaliana
Abstract
Background: To survive in a changing environment plants constantly monitor their surroundings. In response to several stresses and during photorespiration plants use reactive oxygen species as signaling molecules. The Arabidopsis thaliana catalase2 (cat2) mutant lacks a peroxisomal catalase and under photorespiratory conditions accumulates H2O2, which leads to activation of cell death.
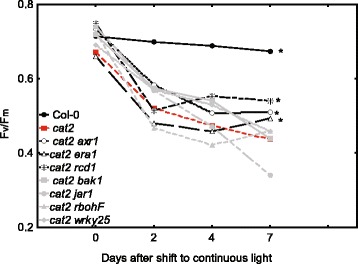
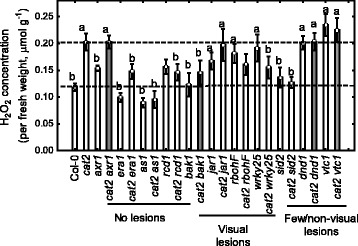
Methods: A cat2 double mutant collection was generated through crossing and scored for cell death in different assays. Selected double mutants were further analyzed for photosynthetic performance and H2O2 accumulation.
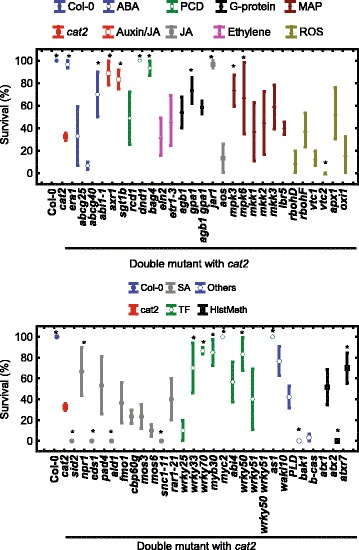
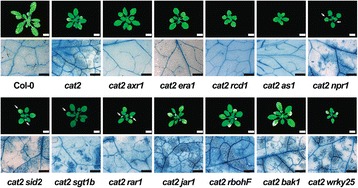
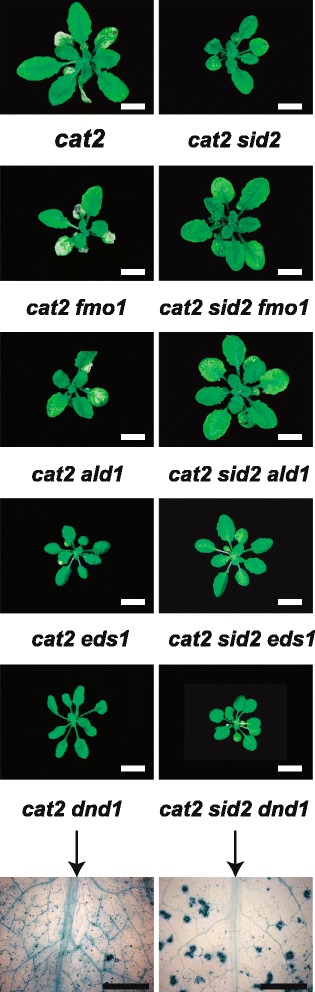
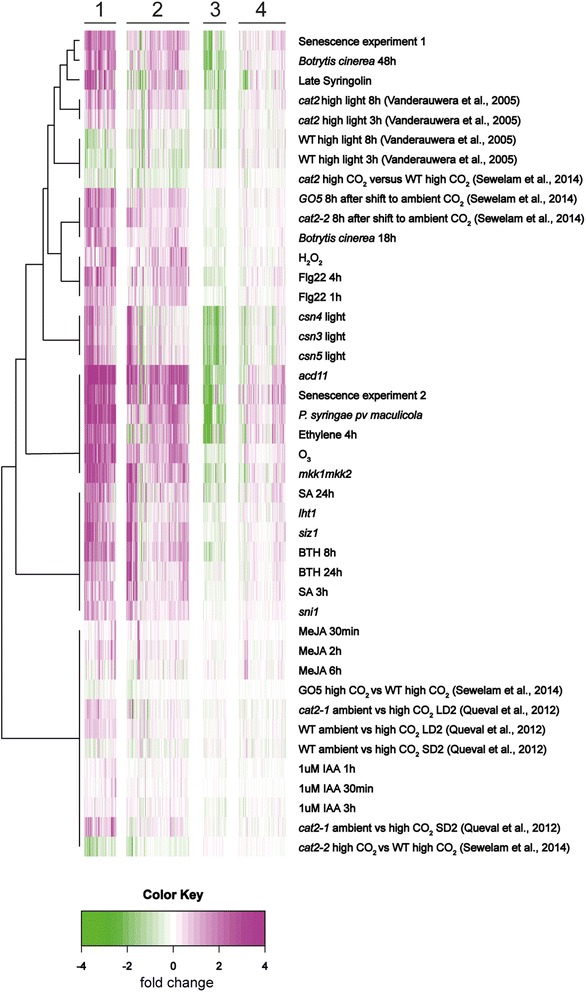
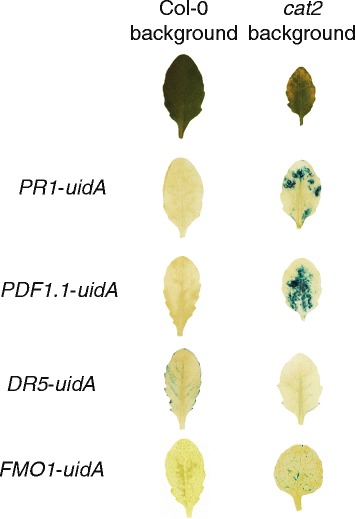
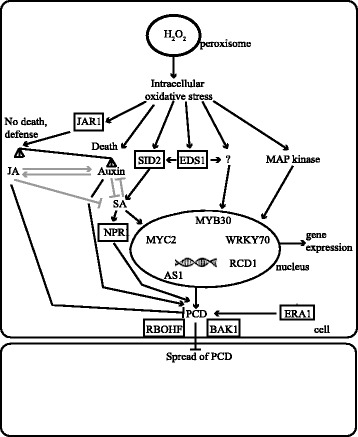
Results: We used a targeted mutant analysis with more than 50 cat2 double mutants to investigate the role of stress hormones and other defense regulators in H2O2-mediated cell death. Several transcription factors (AS1, MYB30, MYC2, WRKY70), cell death regulators (RCD1, DND1) and hormone regulators (AXR1, ERA1, SID2, EDS1, SGT1b) were essential for execution of cell death in cat2. Genetic loci required for cell death in cat2 was compared with regulators of cell death in spontaneous lesion mimic mutants and led to the identification of a core set of plant cell death regulators. Analysis of gene expression data from cat2 and plants undergoing cell death revealed similar gene expression profiles, further supporting the existence of a common program for regulation of plant cell death.
Conclusions: Our results provide a genetic framework for further study on the role of H2O2 in regulation of cell death. The hormones salicylic acid, jasmonic acid and auxin, as well as their interaction, are crucial determinants of cell death regulation.
Figures
Similar articles
-
Stress Marker Signatures in Lesion Mimic Single and Double Mutants Identify a Crucial Leaf Age-Dependent Salicylic Acid Related Defense Signal.PLoS One. 2017 Jan 20;12(1):e0170532. doi: 10.1371/journal.pone.0170532. eCollection 2017. PLoS One. 2017. PMID: 28107453 Free PMC article.
-
CATALASE2 Coordinates SA-Mediated Repression of Both Auxin Accumulation and JA Biosynthesis in Plant Defenses.Cell Host Microbe. 2017 Feb 8;21(2):143-155. doi: 10.1016/j.chom.2017.01.007. Cell Host Microbe. 2017. PMID: 28182949
-
SHORT-ROOT Deficiency Alleviates the Cell Death Phenotype of the Arabidopsis catalase2 Mutant under Photorespiration-Promoting Conditions.Plant Cell. 2016 Aug;28(8):1844-59. doi: 10.1105/tpc.16.00038. Epub 2016 Jul 18. Plant Cell. 2016. PMID: 27432873 Free PMC article.
-
Chemical Genetics Approach Identifies Abnormal Inflorescence Meristem 1 as a Putative Target of a Novel Sulfonamide That Protects Catalase2-Deficient Arabidopsis against Photorespiratory Stress.Cells. 2020 Sep 2;9(9):2026. doi: 10.3390/cells9092026. Cells. 2020. PMID: 32887516 Free PMC article.
-
Metabolite modification in oxidative stress responses: A case study of two defense hormones.Free Radic Biol Med. 2023 Feb 20;196:145-155. doi: 10.1016/j.freeradbiomed.2023.01.007. Epub 2023 Jan 10. Free Radic Biol Med. 2023. PMID: 36634883 Review.
Cited by
-
Formyl tetrahydrofolate deformylase affects hydrogen peroxide accumulation and leaf senescence by regulating the folate status and redox homeostasis in rice.Sci China Life Sci. 2021 May;64(5):720-738. doi: 10.1007/s11427-020-1773-7. Epub 2020 Sep 14. Sci China Life Sci. 2021. PMID: 32949368
-
Quantitative Trait Locus Mapping for Plant Height and Branch Number in CCRI70 Recombinant Inbred Line Population of Upland Cotton (Gossypium hirsutum).Plants (Basel). 2024 May 30;13(11):1509. doi: 10.3390/plants13111509. Plants (Basel). 2024. PMID: 38891318 Free PMC article.
-
Cellular oxidative stress in programmed cell death: focusing on chloroplastic 1O2 and mitochondrial cytochrome-c release.J Plant Res. 2021 Mar;134(2):179-194. doi: 10.1007/s10265-021-01259-7. Epub 2021 Feb 10. J Plant Res. 2021. PMID: 33569718
-
The Key Roles of ROS and RNS as a Signaling Molecule in Plant-Microbe Interactions.Antioxidants (Basel). 2023 Jan 25;12(2):268. doi: 10.3390/antiox12020268. Antioxidants (Basel). 2023. PMID: 36829828 Free PMC article. Review.
-
Plasma membrane aquaporins of the PIP1 and PIP2 subfamilies facilitate hydrogen peroxide diffusion into plant roots.BMC Plant Biol. 2022 Dec 5;22(1):566. doi: 10.1186/s12870-022-03962-6. BMC Plant Biol. 2022. PMID: 36471241 Free PMC article.
References
Publication types
MeSH terms
Substances
LinkOut - more resources
Full Text Sources
Other Literature Sources
Molecular Biology Databases
