. 2016 Apr;23(4):707-22.
doi: 10.1038/cdd.2015.133. Epub 2015 Oct 23.

DNA damage-induced ephrin-B2 reverse signaling promotes chemoresistance and drives EMT in colorectal carcinoma harboring mutant p53

Affiliations

DNA damage-induced ephrin-B2 reverse signaling promotes chemoresistance and drives EMT in colorectal carcinoma harboring mutant p53

S K Alam et al. Cell Death Differ. 2016 Apr.

Abstract

Mutation in the TP53 gene positively correlates with increased incidence of chemoresistance in different cancers. In this study, we investigated the mechanism of chemoresistance and epithelial-to-mesenchymal transition (EMT) in colorectal cancer involving the gain-of-function (GOF) mutant p53/ephrin-B2 signaling axis. Bioinformatic analysis of the NCI-60 data set and subsequent hub prediction identified EFNB2 as a possible GOF mutant p53 target gene, responsible for chemoresistance. We show that the mutant p53-NF-Y complex transcriptionally upregulates EFNB2 expression in response to DNA damage. Moreover, the acetylated form of mutant p53 protein is recruited on the EFNB2 promoter and positively regulates its expression in conjunction with coactivator p300. In vitro cell line and in vivo nude mice data show that EFNB2 silencing restores chemosensitivity in mutant p53-harboring tumors. In addition, we observed high expression of EFNB2 in patients having neoadjuvant non-responder colorectal carcinoma compared with those having responder version of the disease. In the course of deciphering the drug resistance mechanism, we also show that ephrin-B2 reverse signaling induces ABCG2 expression after drug treatment that involves JNK-c-Jun signaling in mutant p53 cells. Moreover, 5-fluorouracil-induced ephrin-B2 reverse signaling promotes tumorigenesis through the Src-ERK pathway, and drives EMT via the Src-FAK pathway. We thus conclude that targeting ephrin-B2 might enhance the therapeutic potential of DNA-damaging chemotherapeutic agents in mutant p53-bearing human tumors.


Figures
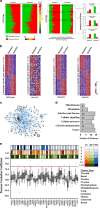
Figure 1
Figure 1
Predicting gain-of-function (GOF) mutant p53 regulated gene signature. (a) Classification of sensitive/resistant cell lines on the basis of wild-type and mutant p53 status across 1400 drugs. (b) Heat map showing differential gene expression pattern. (c) 1st level interaction network of 262 genes. Nodes that belonged to 262 gene set are larger in size. Hubs (n=42) are red in color. Only two hubs (ubiquitin and EGFR) do not belong to the original 262 genes. (d) Count of pathways for 42 hubs. Total 76 unique pathways are classified into seven groups according to their overall action. Total number of hub proteins mapped onto a particular group of pathways is marked at the base of each bar. (e) Pearson's correlation coefficient (PCC) of expression is calculated for 42 hub and their interactors in 11 cancer types. Distribution of PCC for each hub is represented by a box plot. Mean of the distribution are marked by the red square on the boxes. The white stars indicate the PCC of co-expression in colorectal cancer. The number of GO cellular component (CC), GO biological process (BP), and pathways (PTH) are presented by the three colored bar codes at the top of the box plot
Figure 2
Figure 2
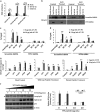
Gain-of-function mutant p53 transcriptionally activates ephrin-B2. (a) Ephrin-B2 protein level remains unchanged upon addition of 5-FU in mutant p53 siRNA (80 nM) treated- MIAPaCa-2 and SW480 cells but upregulation was noticed upon drug treatment in scrambled siRNA-treated cells. (b) Transient transfection of gain-of-function mutant p53 (R273H) in HCT116p53−/− cells showed increase of ephrin-B2 expression upon 5-FU addition, whereas wild-type p53 transfected cells served as a control. (c) EFNB2 promoter activity remain constant upon incubation of mutant p53 siRNA (80 nM) and 5-FU in four different endogenous mutant cells, whereas sharp increment of EFNB2 promoter activity has been noticed upon treatment of drug in scrambled siRNA-treated cells. Immunoblot is showing decrease in p53 expression. (d) Increase of EFNB2 promoter activity has been observed by co-transfection of either R273H or R175H mutant p53 cDNA plasmids along with drug treatment. Wild-type p53 transfected cells served as a control. Immunoblot is showing overexpression of p53 protein. All histograms were expressed as means±S.D. of three independent experiments. *, **, ***, and **** indicate P≤0.05, P≤0.01, P≤0.001, and P≤0.0001, respectively. Histograms show densitometric values of band intensity
Figure 3
Figure 3
Mutant p53 in association with NF-Y facilitates ephrin-B2 transactivation. (a) Dual Luciferase assay showing ectopic expression of wild-type (WT) NF-YA protein enhances EFNB2 promoter activity. (b) Co-immunoprecipitation experiment showing the presence of mutant p53 and NF-Y complex in scrambled shRNA-transduced SW480 cells. (c) Chromatin immunoprecipitation (ChIP) experiment showing recruitment of NF-YA, NF-YB, and mutant p53 proteins on the endogenous EFNB2 promoter in control shRNA-transduced, but not in p53 shRNA-transduced SW480 cells. (d) Chromatin immunoprecipitation (ChIP) experiment showing recruitment of mutant p53, NF-YA, and NF-YB protein on the endogenous EFNB2 promoter in control siRNA-transfected cells, but not in NF-YA siRNA-transfected SW480 cells. (e) ChIP assay in mutant p53-harboring SW480 cells showing recruitment of acetyl-p53 (Lys 382) and p300 on the EFNB2 promoter in the presence of triply acetylated (wild-type) peptide (380–386; K381Ac/K382Ac/K386Ac) and unacetylated (mutant) peptide (380–386; K381A/K382A/L383A). (f) Triply acetylated peptide (380–386; K381Ac/K382Ac/K386Ac) treatment in mutant p53-harboring SW480 cells inhibit 5-FU-induced enhancement of ephrin-B2 expression. All histograms were expressed as means±S.D. of three independent experiments. *, **, ***, and **** indicate P≤0.05, P≤0.01, P≤0.001, and P≤0.0001, respectively. Histograms show densitometric values of band intensity
Figure 4
Figure 4
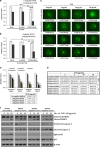
Knockdown of ephrin-B2 in mutant p53 cancer cells showing drug sensitivity. (a) Cell viability assay in endogenous SW480 cells and (b) R273H mutant p53-expressing stable H1299 cell lines showed enhanced sensitivity to 5-FU (10 μg/ml for 48 h). (c) Fluorescence micrograph showing clear spheroids in three-dimensional (3D) cell culture assay. ‘r' represents radius. Scale bar denotes 200 μm. (d) Dose-dependent decrease of spheroid size (μm) and area (× 10−2 mm2) in 3D cell culture. (e) Dose-dependent decrease of cell viability in 3D cell culture. (f) Immunoblot showing time-dependent increase of PARP-I and Caspase-3 cleavage in ephrin-B2 knocked down cell lines. All histograms, spheroid size, and IC50 data were expressed as means±S.D. of three independent experiments. *, **, ***, and **** indicate P≤0.05, P≤0.01, P≤0.001, and P≤0.0001, respectively
Figure 5
Figure 5
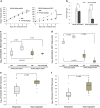
Silencing of ephrin-B2 inhibits tumor growth in vivo upon 5-FU treatment. (a) Representative graphs indicate tumor growth rate in either non-silencing control or ephrin-B2 knocked down SW480 cells. (b) The weight of the tumors was measured in gms. Histograms are represented as means±S.E.M. (c and d) Total RNA was isolated from SW480 shScrambled (n=5) and SW480 shEphrin-B2#53 (n=5) tumors. Expression of two genes (ABCG2 and ABCC1) was measured. (e and f) Total RNA was isolated from neoadjuvant therapy-resistant human colon carcinoma (n=10) and neoadjuvant therapy-sensitive human colon carcinoma (n=10). mRNA expression of two genes (ABCC1 and EFNB2) was measured
Figure 6
Figure 6
Ephrin-B2 reverse signaling exhibits chemoresistance influencing ABCG2 expression. (a) Immunoblot analysis of ABCG2 in agonist-treated SW480 cells (b) mRNA expression of ABCG2 in ephrin-B2 knocked down and overexpressed condition. (c) Immunoblot analysis of phospho-JNK and phospho-c-Jun in agonist-treated SW480 cells. (d) Cells were harvested at 48 h post 5-FU treatment and subjected to immunoblot analysis with α-phospho-JNK and α-phospho-c-Jun. Silencing of ephrin-B2 was ascertained with α-ephrin-B2. (e) ChIP assay showing recruitment of c-Jun and RNA polymerase II on the EFNB2 promoter. (f) ChIP Assay showing recruitment of RNA polymerase II and no recruitment of c-Jun on the GAPDH promoter. (g) Knockdown of JNK protein in SW480 cells increases PARP-I cleavage. Histograms show densitometric values of band intensity and express as means±S.D. of three independent experiments. * indicates P≤0.05
Figure 7
Figure 7
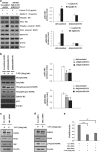
Ephrin-B2 reverse signaling promotes cell proliferation in mutant p53 cancer. (a) Immunoblot analysis of α-phospho SRC and α-phospho p44/p42 MAPK in agonist-treated cells. (b) Cells were harvested at 48 h post 5-FU treatment and subjected to immunoblot analysis with α-phospho SRC and α-phospho p44/p42 MAPK. (c) Knockdown of Src protein and (d) ERK (p44/p42 MAPK) protein in SW480 cells increase PARP-I cleavage with concomitant decrease in PCNA expression. (e) 5-FU induced decrease of viability in SW480 cells following pretreatment with either Src or ERK siRNA. All histograms were expressed as means±S.D. of three independent experiments. *, **, ***, and **** indicate P≤0.05, P≤0.01, P≤0.001, and P≤0.0001, respectively. Histograms show densitometric values of band intensity
Figure 8
Figure 8
Ephrin-B2 reverse signaling drives EMT in mutant p53 cancer. (a) Agonist-treated cells were subjected to immunoblot analysis with α-phospho FAK, α-E-cadherin, α-SNAI-1, and α-ID-1. (b) 5-FU-treated non-silencing control and ephrin-B2 knocked down cells were subjected to immunoblot analysis with α-phospho FAK, α-E-cadherin, α-Vimentin, α-Snail, and α-Slug. Silencing of ephrin-B2 was ascertained with α-ephrin-B2. (c) Perturbation of FAK in SW480 cells reverses EMT phenotype. (d) Model of our working hypothesis showing ephrin-B2 expression is upregulated in response to DNA damage by NF-Y/mutant p53/p300 complex. Drug induced ephrin-B2 reverse signaling evade apoptosis and impart chemoresistance involving JNK/c-Jun signaling. Ephrin-B2 reverse signaling also drives EMT and promotes cancer cell proliferation involving Src/FAK and Src/ERK signaling, respectively

References

    1. Cayuso J, Xu Q, Wilkinson DG. Mechanisms of boundary formation by Eph receptor and ephrin signaling. Dev Biol 2015; 401: 122–131. - PubMed
    1. Tallquist MD, Soriano P, Klinghoffer RA. Growth factor signaling pathways in vascular development. Oncogene 1999; 18: 7917–7932. - PubMed
    1. Pasquale EB. Eph receptor signalling casts a wide net on cell behaviour. Nat Rev Mol Cell Biol 2005; 6: 462–475. - PubMed
    1. Senturk A, Pfennig S, Weiss A, Burk K, Acker-Palmer A. Ephrin Bs are essential components of the Reelin pathway to regulate neuronal migration. Nature 2011; 472: 356–360. - PubMed
    1. Pasquale EB. Eph receptors and ephrins in cancer: bidirectional signalling and beyond. Nat Rev Cancer 2010; 10: 165–180. - PMC - PubMed

Publication types

MeSH terms